Slavic vs Immigrants from Liberia In Labor Force | Age > 16
COMPARE
Slavic
Immigrants from Liberia
In Labor Force | Age > 16
In Labor Force | Age > 16 Comparison
Slavs
Immigrants from Liberia
64.6%
IN LABOR FORCE | AGE > 16
4.9/ 100
METRIC RATING
233rd/ 347
METRIC RANK
67.6%
IN LABOR FORCE | AGE > 16
100.0/ 100
METRIC RATING
18th/ 347
METRIC RANK
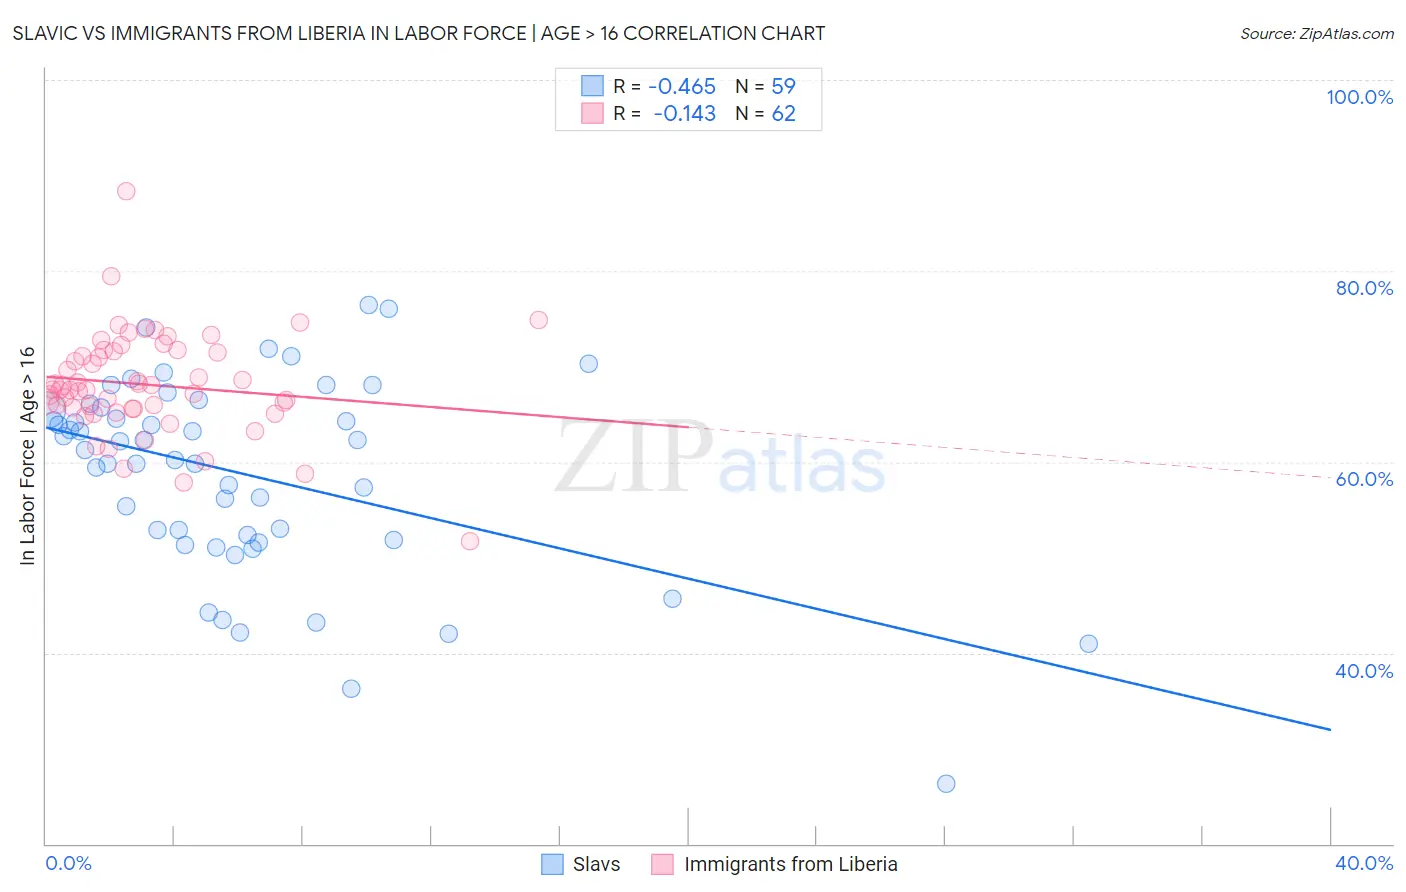
Slavic vs Immigrants from Liberia In Labor Force | Age > 16 Correlation Chart
The statistical analysis conducted on geographies consisting of 270,879,770 people shows a moderate negative correlation between the proportion of Slavs and labor force participation rate among population ages 16 and over in the United States with a correlation coefficient (R) of -0.465 and weighted average of 64.6%. Similarly, the statistical analysis conducted on geographies consisting of 135,283,849 people shows a poor negative correlation between the proportion of Immigrants from Liberia and labor force participation rate among population ages 16 and over in the United States with a correlation coefficient (R) of -0.143 and weighted average of 67.6%, a difference of 4.7%.
In Labor Force | Age > 16 Correlation Summary
| Measurement | Slavic | Immigrants from Liberia |
| Minimum | 26.3% | 51.7% |
| Maximum | 76.4% | 88.3% |
| Range | 50.1% | 36.6% |
| Mean | 58.7% | 68.1% |
| Median | 61.2% | 67.6% |
| Interquartile 25% (IQ1) | 51.8% | 65.6% |
| Interquartile 75% (IQ3) | 65.8% | 71.5% |
| Interquartile Range (IQR) | 14.0% | 6.0% |
| Standard Deviation (Sample) | 10.3% | 5.4% |
| Standard Deviation (Population) | 10.2% | 5.4% |
Similar Demographics by In Labor Force | Age > 16
Demographics Similar to Slavs by In Labor Force | Age > 16
In terms of in labor force | age > 16, the demographic groups most similar to Slavs are Vietnamese (64.6%, a difference of 0.010%), Austrian (64.6%, a difference of 0.020%), Immigrants from Norway (64.6%, a difference of 0.020%), Italian (64.6%, a difference of 0.020%), and African (64.6%, a difference of 0.050%).
| Demographics | Rating | Rank | In Labor Force | Age > 16 |
| Europeans | 8.3 /100 | #226 | Tragic 64.7% |
| Poles | 8.3 /100 | #227 | Tragic 64.7% |
| Northern Europeans | 8.2 /100 | #228 | Tragic 64.7% |
| British | 7.3 /100 | #229 | Tragic 64.7% |
| Chinese | 7.3 /100 | #230 | Tragic 64.7% |
| Immigrants | Northern Europe | 7.2 /100 | #231 | Tragic 64.7% |
| Africans | 5.8 /100 | #232 | Tragic 64.6% |
| Slavs | 4.9 /100 | #233 | Tragic 64.6% |
| Vietnamese | 4.7 /100 | #234 | Tragic 64.6% |
| Austrians | 4.6 /100 | #235 | Tragic 64.6% |
| Immigrants | Norway | 4.6 /100 | #236 | Tragic 64.6% |
| Italians | 4.6 /100 | #237 | Tragic 64.6% |
| Lebanese | 3.9 /100 | #238 | Tragic 64.5% |
| Immigrants | Hungary | 3.8 /100 | #239 | Tragic 64.5% |
| Immigrants | Bangladesh | 3.6 /100 | #240 | Tragic 64.5% |
Demographics Similar to Immigrants from Liberia by In Labor Force | Age > 16
In terms of in labor force | age > 16, the demographic groups most similar to Immigrants from Liberia are Immigrants from India (67.6%, a difference of 0.020%), Kenyan (67.6%, a difference of 0.040%), Immigrants from Sudan (67.7%, a difference of 0.090%), Immigrants from Kenya (67.6%, a difference of 0.090%), and Tongan (67.5%, a difference of 0.10%).
| Demographics | Rating | Rank | In Labor Force | Age > 16 |
| Bolivians | 100.0 /100 | #11 | Exceptional 68.2% |
| Sudanese | 100.0 /100 | #12 | Exceptional 68.0% |
| Immigrants | Nepal | 100.0 /100 | #13 | Exceptional 68.0% |
| Liberians | 100.0 /100 | #14 | Exceptional 67.8% |
| Immigrants | Middle Africa | 100.0 /100 | #15 | Exceptional 67.7% |
| Immigrants | Sudan | 100.0 /100 | #16 | Exceptional 67.7% |
| Immigrants | India | 100.0 /100 | #17 | Exceptional 67.6% |
| Immigrants | Liberia | 100.0 /100 | #18 | Exceptional 67.6% |
| Kenyans | 100.0 /100 | #19 | Exceptional 67.6% |
| Immigrants | Kenya | 100.0 /100 | #20 | Exceptional 67.6% |
| Tongans | 100.0 /100 | #21 | Exceptional 67.5% |
| Immigrants | Uganda | 100.0 /100 | #22 | Exceptional 67.5% |
| Cambodians | 100.0 /100 | #23 | Exceptional 67.4% |
| Ugandans | 100.0 /100 | #24 | Exceptional 67.4% |
| Immigrants | Africa | 100.0 /100 | #25 | Exceptional 67.4% |