Spanish vs Paraguayan In Labor Force | Age > 16
COMPARE
Spanish
Paraguayan
In Labor Force | Age > 16
In Labor Force | Age > 16 Comparison
Spanish
Paraguayans
63.9%
IN LABOR FORCE | AGE > 16
0.1/ 100
METRIC RATING
288th/ 347
METRIC RANK
66.5%
IN LABOR FORCE | AGE > 16
99.9/ 100
METRIC RATING
52nd/ 347
METRIC RANK
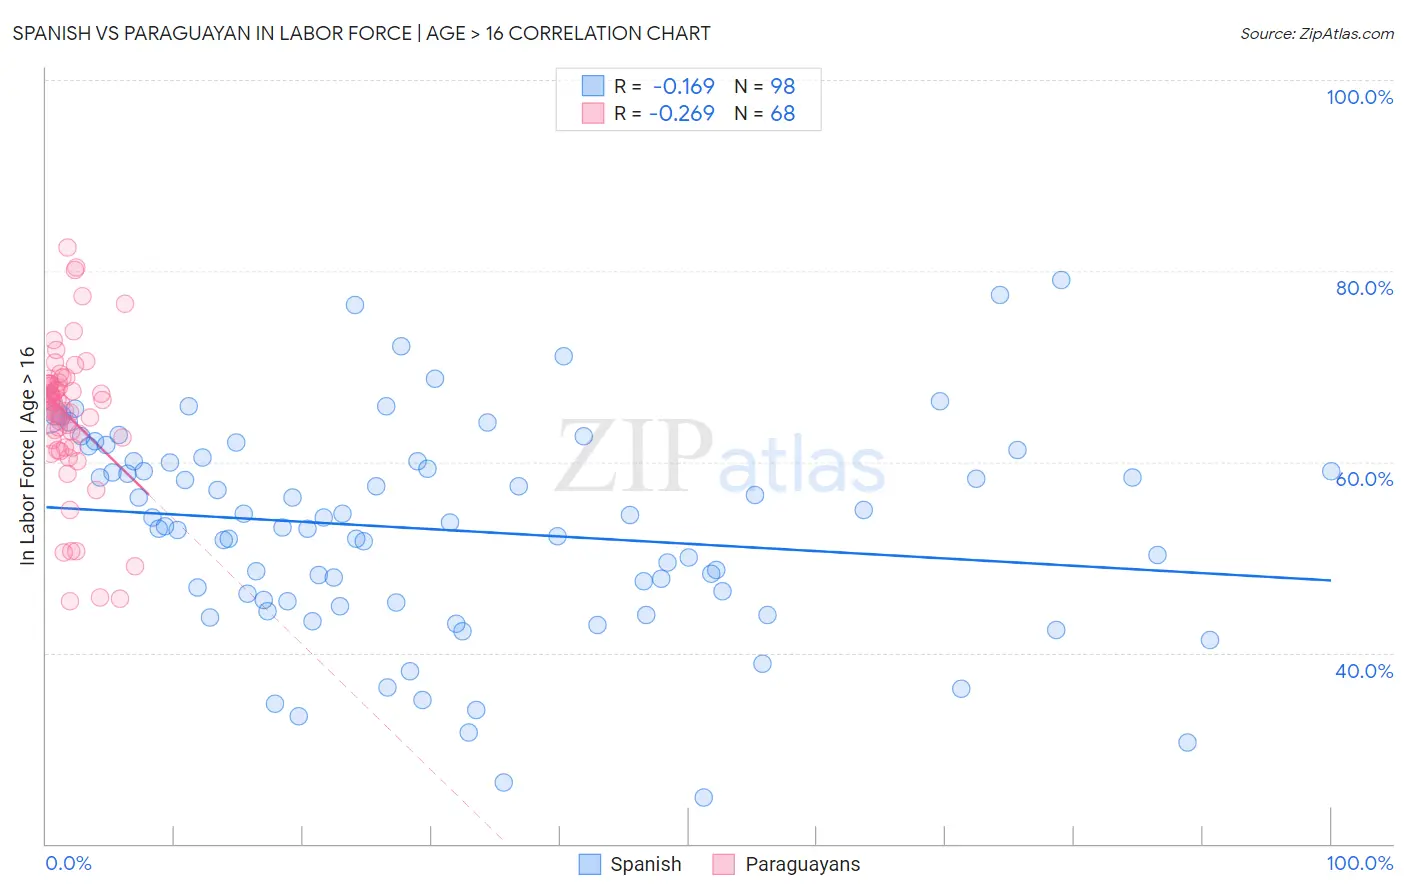
Spanish vs Paraguayan In Labor Force | Age > 16 Correlation Chart
The statistical analysis conducted on geographies consisting of 422,185,482 people shows a poor negative correlation between the proportion of Spanish and labor force participation rate among population ages 16 and over in the United States with a correlation coefficient (R) of -0.169 and weighted average of 63.9%. Similarly, the statistical analysis conducted on geographies consisting of 95,115,093 people shows a weak negative correlation between the proportion of Paraguayans and labor force participation rate among population ages 16 and over in the United States with a correlation coefficient (R) of -0.269 and weighted average of 66.5%, a difference of 4.1%.
In Labor Force | Age > 16 Correlation Summary
| Measurement | Spanish | Paraguayan |
| Minimum | 24.8% | 45.4% |
| Maximum | 79.0% | 82.5% |
| Range | 54.2% | 37.1% |
| Mean | 52.9% | 64.8% |
| Median | 53.5% | 66.1% |
| Interquartile 25% (IQ1) | 45.4% | 61.9% |
| Interquartile 75% (IQ3) | 60.1% | 68.2% |
| Interquartile Range (IQR) | 14.7% | 6.3% |
| Standard Deviation (Sample) | 11.0% | 7.6% |
| Standard Deviation (Population) | 11.0% | 7.5% |
Similar Demographics by In Labor Force | Age > 16
Demographics Similar to Spanish by In Labor Force | Age > 16
In terms of in labor force | age > 16, the demographic groups most similar to Spanish are Celtic (63.8%, a difference of 0.030%), Immigrants from Austria (63.9%, a difference of 0.050%), Scottish (63.9%, a difference of 0.050%), Hungarian (63.8%, a difference of 0.060%), and Slovak (63.9%, a difference of 0.070%).
| Demographics | Rating | Rank | In Labor Force | Age > 16 |
| French Canadians | 0.2 /100 | #281 | Tragic 64.0% |
| Immigrants | Guyana | 0.2 /100 | #282 | Tragic 64.0% |
| Immigrants | Germany | 0.1 /100 | #283 | Tragic 63.9% |
| French | 0.1 /100 | #284 | Tragic 63.9% |
| Slovaks | 0.1 /100 | #285 | Tragic 63.9% |
| Immigrants | Austria | 0.1 /100 | #286 | Tragic 63.9% |
| Scottish | 0.1 /100 | #287 | Tragic 63.9% |
| Spanish | 0.1 /100 | #288 | Tragic 63.9% |
| Celtics | 0.1 /100 | #289 | Tragic 63.8% |
| Hungarians | 0.1 /100 | #290 | Tragic 63.8% |
| Nepalese | 0.1 /100 | #291 | Tragic 63.8% |
| Spanish American Indians | 0.1 /100 | #292 | Tragic 63.8% |
| English | 0.1 /100 | #293 | Tragic 63.7% |
| Puget Sound Salish | 0.0 /100 | #294 | Tragic 63.7% |
| Immigrants | Canada | 0.0 /100 | #295 | Tragic 63.7% |
Demographics Similar to Paraguayans by In Labor Force | Age > 16
In terms of in labor force | age > 16, the demographic groups most similar to Paraguayans are Immigrants from Sri Lanka (66.5%, a difference of 0.020%), Immigrants from Kuwait (66.5%, a difference of 0.030%), Immigrants from Bosnia and Herzegovina (66.5%, a difference of 0.050%), Cape Verdean (66.6%, a difference of 0.10%), and Immigrants from Venezuela (66.4%, a difference of 0.10%).
| Demographics | Rating | Rank | In Labor Force | Age > 16 |
| Immigrants | Brazil | 100.0 /100 | #45 | Exceptional 66.7% |
| Brazilians | 100.0 /100 | #46 | Exceptional 66.6% |
| Immigrants | Bulgaria | 100.0 /100 | #47 | Exceptional 66.6% |
| Nigerians | 100.0 /100 | #48 | Exceptional 66.6% |
| Immigrants | Northern Africa | 100.0 /100 | #49 | Exceptional 66.6% |
| Cape Verdeans | 100.0 /100 | #50 | Exceptional 66.6% |
| Immigrants | Kuwait | 100.0 /100 | #51 | Exceptional 66.5% |
| Paraguayans | 99.9 /100 | #52 | Exceptional 66.5% |
| Immigrants | Sri Lanka | 99.9 /100 | #53 | Exceptional 66.5% |
| Immigrants | Bosnia and Herzegovina | 99.9 /100 | #54 | Exceptional 66.5% |
| Immigrants | Venezuela | 99.9 /100 | #55 | Exceptional 66.4% |
| Immigrants | Senegal | 99.9 /100 | #56 | Exceptional 66.4% |
| Bulgarians | 99.9 /100 | #57 | Exceptional 66.4% |
| Immigrants | Saudi Arabia | 99.9 /100 | #58 | Exceptional 66.3% |
| Immigrants | Turkey | 99.9 /100 | #59 | Exceptional 66.3% |