Spanish vs Pueblo In Labor Force | Age > 16
COMPARE
Spanish
Pueblo
In Labor Force | Age > 16
In Labor Force | Age > 16 Comparison
Spanish
Pueblo
63.9%
IN LABOR FORCE | AGE > 16
0.1/ 100
METRIC RATING
288th/ 347
METRIC RANK
59.3%
IN LABOR FORCE | AGE > 16
0.0/ 100
METRIC RATING
340th/ 347
METRIC RANK
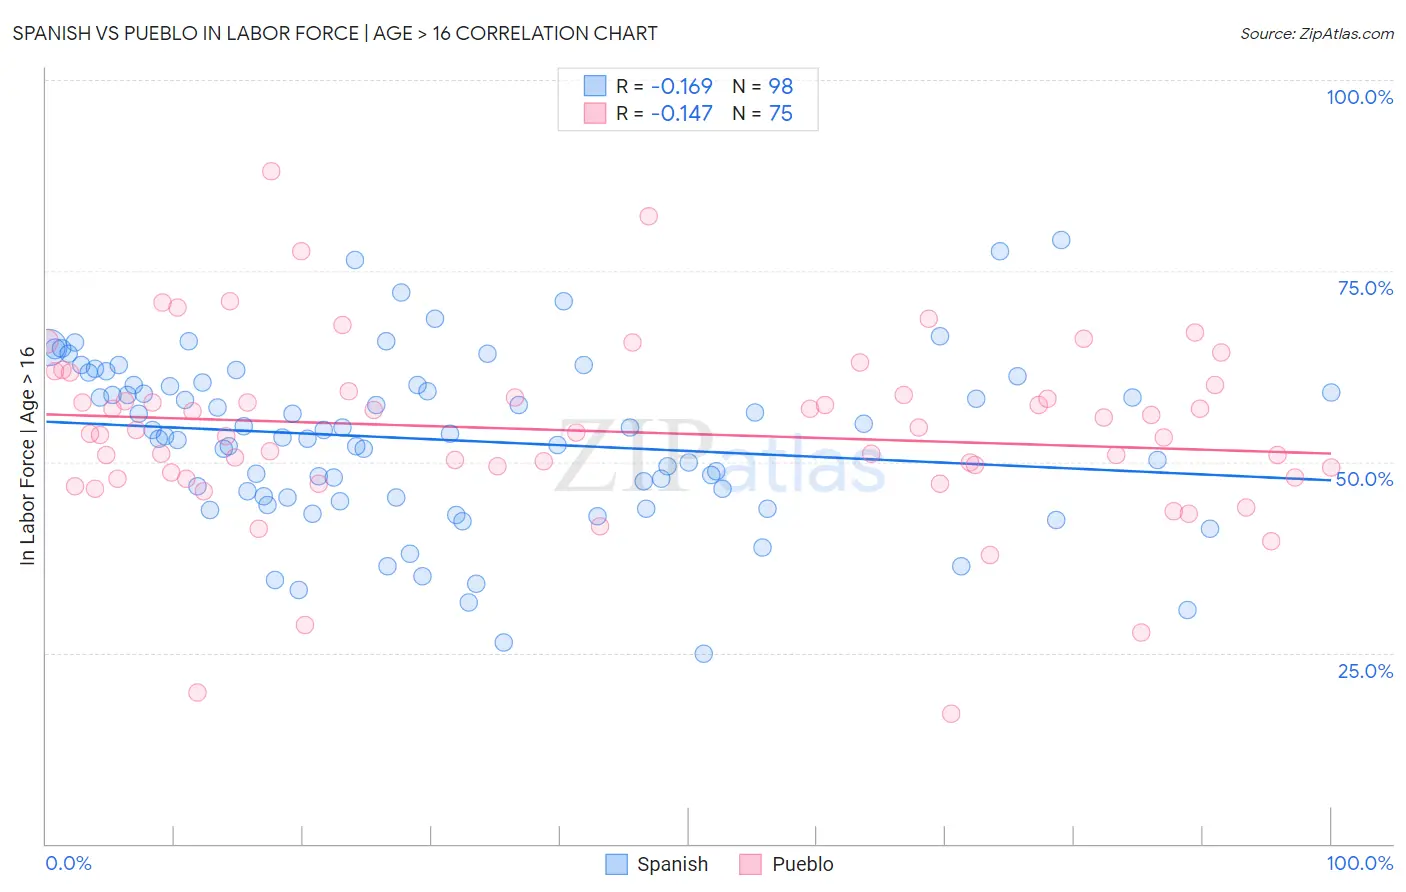
Spanish vs Pueblo In Labor Force | Age > 16 Correlation Chart
The statistical analysis conducted on geographies consisting of 422,185,482 people shows a poor negative correlation between the proportion of Spanish and labor force participation rate among population ages 16 and over in the United States with a correlation coefficient (R) of -0.169 and weighted average of 63.9%. Similarly, the statistical analysis conducted on geographies consisting of 120,084,171 people shows a poor negative correlation between the proportion of Pueblo and labor force participation rate among population ages 16 and over in the United States with a correlation coefficient (R) of -0.147 and weighted average of 59.3%, a difference of 7.7%.
In Labor Force | Age > 16 Correlation Summary
| Measurement | Spanish | Pueblo |
| Minimum | 24.8% | 17.1% |
| Maximum | 79.0% | 88.1% |
| Range | 54.2% | 71.0% |
| Mean | 52.9% | 54.0% |
| Median | 53.5% | 53.9% |
| Interquartile 25% (IQ1) | 45.4% | 48.0% |
| Interquartile 75% (IQ3) | 60.1% | 59.2% |
| Interquartile Range (IQR) | 14.7% | 11.2% |
| Standard Deviation (Sample) | 11.0% | 11.9% |
| Standard Deviation (Population) | 11.0% | 11.9% |
Similar Demographics by In Labor Force | Age > 16
Demographics Similar to Spanish by In Labor Force | Age > 16
In terms of in labor force | age > 16, the demographic groups most similar to Spanish are Celtic (63.8%, a difference of 0.030%), Immigrants from Austria (63.9%, a difference of 0.050%), Scottish (63.9%, a difference of 0.050%), Hungarian (63.8%, a difference of 0.060%), and Slovak (63.9%, a difference of 0.070%).
| Demographics | Rating | Rank | In Labor Force | Age > 16 |
| French Canadians | 0.2 /100 | #281 | Tragic 64.0% |
| Immigrants | Guyana | 0.2 /100 | #282 | Tragic 64.0% |
| Immigrants | Germany | 0.1 /100 | #283 | Tragic 63.9% |
| French | 0.1 /100 | #284 | Tragic 63.9% |
| Slovaks | 0.1 /100 | #285 | Tragic 63.9% |
| Immigrants | Austria | 0.1 /100 | #286 | Tragic 63.9% |
| Scottish | 0.1 /100 | #287 | Tragic 63.9% |
| Spanish | 0.1 /100 | #288 | Tragic 63.9% |
| Celtics | 0.1 /100 | #289 | Tragic 63.8% |
| Hungarians | 0.1 /100 | #290 | Tragic 63.8% |
| Nepalese | 0.1 /100 | #291 | Tragic 63.8% |
| Spanish American Indians | 0.1 /100 | #292 | Tragic 63.8% |
| English | 0.1 /100 | #293 | Tragic 63.7% |
| Puget Sound Salish | 0.0 /100 | #294 | Tragic 63.7% |
| Immigrants | Canada | 0.0 /100 | #295 | Tragic 63.7% |
Demographics Similar to Pueblo by In Labor Force | Age > 16
In terms of in labor force | age > 16, the demographic groups most similar to Pueblo are Houma (59.5%, a difference of 0.39%), Immigrants from Yemen (59.6%, a difference of 0.64%), Colville (59.8%, a difference of 0.92%), Hopi (58.4%, a difference of 1.5%), and Puerto Rican (58.1%, a difference of 2.0%).
| Demographics | Rating | Rank | In Labor Force | Age > 16 |
| Paiute | 0.0 /100 | #333 | Tragic 60.7% |
| Apache | 0.0 /100 | #334 | Tragic 60.7% |
| Natives/Alaskans | 0.0 /100 | #335 | Tragic 60.6% |
| Menominee | 0.0 /100 | #336 | Tragic 60.6% |
| Colville | 0.0 /100 | #337 | Tragic 59.8% |
| Immigrants | Yemen | 0.0 /100 | #338 | Tragic 59.6% |
| Houma | 0.0 /100 | #339 | Tragic 59.5% |
| Pueblo | 0.0 /100 | #340 | Tragic 59.3% |
| Hopi | 0.0 /100 | #341 | Tragic 58.4% |
| Puerto Ricans | 0.0 /100 | #342 | Tragic 58.1% |
| Yuman | 0.0 /100 | #343 | Tragic 57.8% |
| Pima | 0.0 /100 | #344 | Tragic 57.4% |
| Tohono O'odham | 0.0 /100 | #345 | Tragic 57.2% |
| Lumbee | 0.0 /100 | #346 | Tragic 56.8% |
| Navajo | 0.0 /100 | #347 | Tragic 56.6% |