Spanish American vs Immigrants from Belarus In Labor Force | Age > 16
COMPARE
Spanish American
Immigrants from Belarus
In Labor Force | Age > 16
In Labor Force | Age > 16 Comparison
Spanish Americans
Immigrants from Belarus
63.6%
IN LABOR FORCE | AGE > 16
0.0/ 100
METRIC RATING
301st/ 347
METRIC RANK
65.2%
IN LABOR FORCE | AGE > 16
66.0/ 100
METRIC RATING
167th/ 347
METRIC RANK
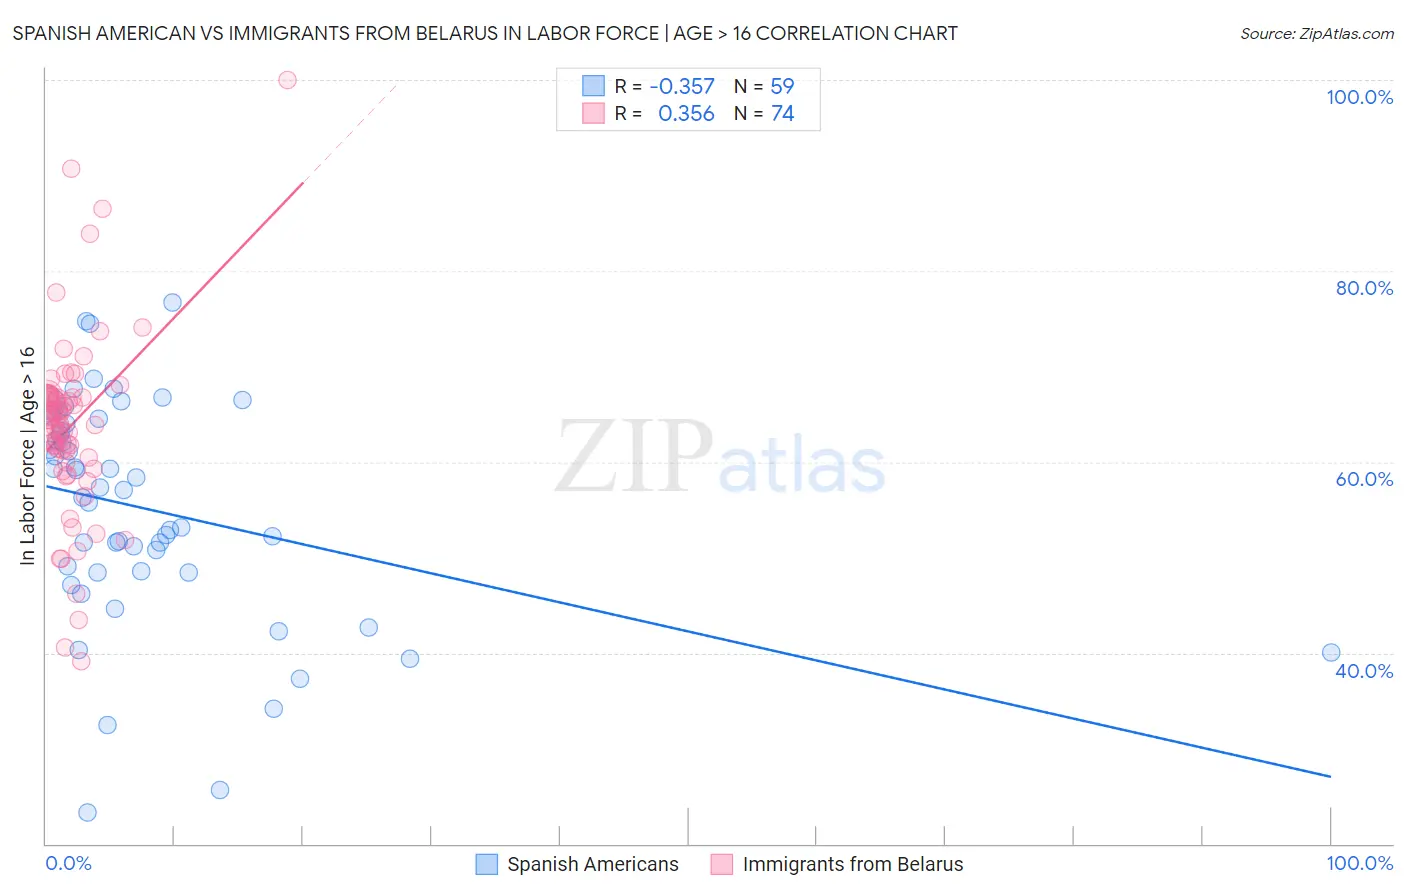
Spanish American vs Immigrants from Belarus In Labor Force | Age > 16 Correlation Chart
The statistical analysis conducted on geographies consisting of 103,168,383 people shows a mild negative correlation between the proportion of Spanish Americans and labor force participation rate among population ages 16 and over in the United States with a correlation coefficient (R) of -0.357 and weighted average of 63.6%. Similarly, the statistical analysis conducted on geographies consisting of 150,205,158 people shows a mild positive correlation between the proportion of Immigrants from Belarus and labor force participation rate among population ages 16 and over in the United States with a correlation coefficient (R) of 0.356 and weighted average of 65.2%, a difference of 2.6%.
In Labor Force | Age > 16 Correlation Summary
| Measurement | Spanish American | Immigrants from Belarus |
| Minimum | 23.3% | 39.1% |
| Maximum | 76.7% | 100.0% |
| Range | 53.4% | 60.9% |
| Mean | 55.1% | 63.8% |
| Median | 57.0% | 64.5% |
| Interquartile 25% (IQ1) | 48.4% | 60.4% |
| Interquartile 75% (IQ3) | 64.5% | 66.8% |
| Interquartile Range (IQR) | 16.1% | 6.4% |
| Standard Deviation (Sample) | 11.7% | 9.7% |
| Standard Deviation (Population) | 11.6% | 9.7% |
Similar Demographics by In Labor Force | Age > 16
Demographics Similar to Spanish Americans by In Labor Force | Age > 16
In terms of in labor force | age > 16, the demographic groups most similar to Spanish Americans are Delaware (63.6%, a difference of 0.010%), White/Caucasian (63.6%, a difference of 0.030%), Immigrants from the Azores (63.6%, a difference of 0.030%), Cree (63.5%, a difference of 0.050%), and Comanche (63.6%, a difference of 0.090%).
| Demographics | Rating | Rank | In Labor Force | Age > 16 |
| Puget Sound Salish | 0.0 /100 | #294 | Tragic 63.7% |
| Immigrants | Canada | 0.0 /100 | #295 | Tragic 63.7% |
| Immigrants | North America | 0.0 /100 | #296 | Tragic 63.7% |
| Immigrants | Grenada | 0.0 /100 | #297 | Tragic 63.6% |
| Comanche | 0.0 /100 | #298 | Tragic 63.6% |
| Whites/Caucasians | 0.0 /100 | #299 | Tragic 63.6% |
| Immigrants | Azores | 0.0 /100 | #300 | Tragic 63.6% |
| Spanish Americans | 0.0 /100 | #301 | Tragic 63.6% |
| Delaware | 0.0 /100 | #302 | Tragic 63.6% |
| Cree | 0.0 /100 | #303 | Tragic 63.5% |
| Immigrants | Nonimmigrants | 0.0 /100 | #304 | Tragic 63.5% |
| Osage | 0.0 /100 | #305 | Tragic 63.5% |
| Blacks/African Americans | 0.0 /100 | #306 | Tragic 63.4% |
| Central American Indians | 0.0 /100 | #307 | Tragic 63.4% |
| Pennsylvania Germans | 0.0 /100 | #308 | Tragic 63.4% |
Demographics Similar to Immigrants from Belarus by In Labor Force | Age > 16
In terms of in labor force | age > 16, the demographic groups most similar to Immigrants from Belarus are Immigrants from Western Asia (65.3%, a difference of 0.020%), Immigrants from Kazakhstan (65.3%, a difference of 0.030%), Serbian (65.2%, a difference of 0.030%), Danish (65.3%, a difference of 0.040%), and Arab (65.2%, a difference of 0.040%).
| Demographics | Rating | Rank | In Labor Force | Age > 16 |
| Immigrants | South Africa | 73.5 /100 | #160 | Good 65.3% |
| Australians | 71.3 /100 | #161 | Good 65.3% |
| Albanians | 70.8 /100 | #162 | Good 65.3% |
| South Africans | 69.8 /100 | #163 | Good 65.3% |
| Danes | 68.8 /100 | #164 | Good 65.3% |
| Immigrants | Kazakhstan | 68.1 /100 | #165 | Good 65.3% |
| Immigrants | Western Asia | 67.3 /100 | #166 | Good 65.3% |
| Immigrants | Belarus | 66.0 /100 | #167 | Good 65.2% |
| Serbians | 63.5 /100 | #168 | Good 65.2% |
| Arabs | 62.4 /100 | #169 | Good 65.2% |
| Immigrants | Israel | 61.7 /100 | #170 | Good 65.2% |
| Israelis | 61.6 /100 | #171 | Good 65.2% |
| Immigrants | Sweden | 61.3 /100 | #172 | Good 65.2% |
| Immigrants | Ukraine | 53.7 /100 | #173 | Average 65.1% |
| Macedonians | 50.0 /100 | #174 | Average 65.1% |