Tohono O'odham vs Immigrants from Cambodia In Labor Force | Age 25-29
COMPARE
Tohono O'odham
Immigrants from Cambodia
In Labor Force | Age 25-29
In Labor Force | Age 25-29 Comparison
Tohono O'odham
Immigrants from Cambodia
77.5%
IN LABOR FORCE | AGE 25-29
0.0/ 100
METRIC RATING
341st/ 347
METRIC RANK
84.4%
IN LABOR FORCE | AGE 25-29
14.3/ 100
METRIC RATING
206th/ 347
METRIC RANK
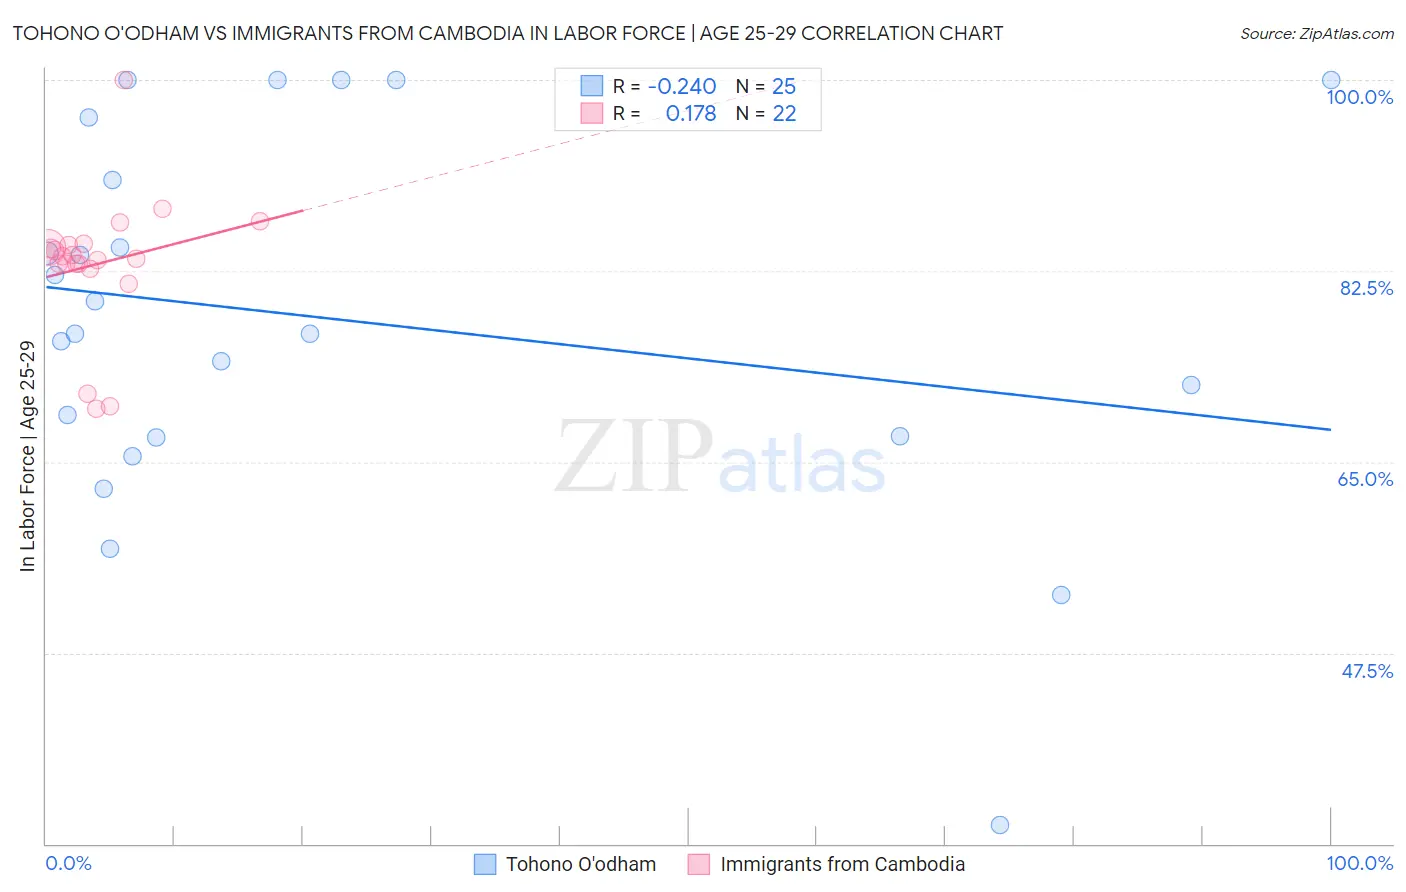
Tohono O'odham vs Immigrants from Cambodia In Labor Force | Age 25-29 Correlation Chart
The statistical analysis conducted on geographies consisting of 58,719,537 people shows a weak negative correlation between the proportion of Tohono O'odham and labor force participation rate among population between the ages 25 and 29 in the United States with a correlation coefficient (R) of -0.240 and weighted average of 77.5%. Similarly, the statistical analysis conducted on geographies consisting of 205,138,607 people shows a poor positive correlation between the proportion of Immigrants from Cambodia and labor force participation rate among population between the ages 25 and 29 in the United States with a correlation coefficient (R) of 0.178 and weighted average of 84.4%, a difference of 8.9%.
In Labor Force | Age 25-29 Correlation Summary
| Measurement | Tohono O'odham | Immigrants from Cambodia |
| Minimum | 31.7% | 69.9% |
| Maximum | 100.0% | 100.0% |
| Range | 68.3% | 30.1% |
| Mean | 78.0% | 83.1% |
| Median | 76.8% | 83.8% |
| Interquartile 25% (IQ1) | 67.3% | 83.2% |
| Interquartile 75% (IQ3) | 93.7% | 84.9% |
| Interquartile Range (IQR) | 26.4% | 1.7% |
| Standard Deviation (Sample) | 17.1% | 6.3% |
| Standard Deviation (Population) | 16.8% | 6.2% |
Similar Demographics by In Labor Force | Age 25-29
Demographics Similar to Tohono O'odham by In Labor Force | Age 25-29
In terms of in labor force | age 25-29, the demographic groups most similar to Tohono O'odham are Pueblo (77.5%, a difference of 0.010%), Paiute (78.1%, a difference of 0.78%), Immigrants from Yemen (78.2%, a difference of 0.94%), Lumbee (78.3%, a difference of 1.1%), and Arapaho (76.6%, a difference of 1.2%).
| Demographics | Rating | Rank | In Labor Force | Age 25-29 |
| Sioux | 0.0 /100 | #333 | Tragic 79.7% |
| Yuman | 0.0 /100 | #334 | Tragic 79.3% |
| Natives/Alaskans | 0.0 /100 | #335 | Tragic 79.3% |
| Apache | 0.0 /100 | #336 | Tragic 79.2% |
| Crow | 0.0 /100 | #337 | Tragic 78.6% |
| Lumbee | 0.0 /100 | #338 | Tragic 78.3% |
| Immigrants | Yemen | 0.0 /100 | #339 | Tragic 78.2% |
| Paiute | 0.0 /100 | #340 | Tragic 78.1% |
| Tohono O'odham | 0.0 /100 | #341 | Tragic 77.5% |
| Pueblo | 0.0 /100 | #342 | Tragic 77.5% |
| Arapaho | 0.0 /100 | #343 | Tragic 76.6% |
| Hopi | 0.0 /100 | #344 | Tragic 76.5% |
| Navajo | 0.0 /100 | #345 | Tragic 74.6% |
| Pima | 0.0 /100 | #346 | Tragic 74.3% |
| Yup'ik | 0.0 /100 | #347 | Tragic 73.1% |
Demographics Similar to Immigrants from Cambodia by In Labor Force | Age 25-29
In terms of in labor force | age 25-29, the demographic groups most similar to Immigrants from Cambodia are Venezuelan (84.4%, a difference of 0.010%), Ecuadorian (84.4%, a difference of 0.010%), Afghan (84.4%, a difference of 0.020%), Immigrants from Afghanistan (84.4%, a difference of 0.020%), and Immigrants from Armenia (84.4%, a difference of 0.020%).
| Demographics | Rating | Rank | In Labor Force | Age 25-29 |
| Immigrants | Germany | 18.3 /100 | #199 | Poor 84.4% |
| Immigrants | Kazakhstan | 17.5 /100 | #200 | Poor 84.4% |
| Laotians | 16.6 /100 | #201 | Poor 84.4% |
| Afghans | 15.9 /100 | #202 | Poor 84.4% |
| Immigrants | Afghanistan | 15.6 /100 | #203 | Poor 84.4% |
| Venezuelans | 15.1 /100 | #204 | Poor 84.4% |
| Ecuadorians | 14.8 /100 | #205 | Poor 84.4% |
| Immigrants | Cambodia | 14.3 /100 | #206 | Poor 84.4% |
| Immigrants | Armenia | 13.3 /100 | #207 | Poor 84.4% |
| Immigrants | Indonesia | 13.2 /100 | #208 | Poor 84.4% |
| Immigrants | Jordan | 12.8 /100 | #209 | Poor 84.4% |
| Chinese | 12.7 /100 | #210 | Poor 84.3% |
| Immigrants | Venezuela | 12.6 /100 | #211 | Poor 84.3% |
| Sub-Saharan Africans | 11.7 /100 | #212 | Poor 84.3% |
| Japanese | 11.4 /100 | #213 | Poor 84.3% |