Immigrants from Oceania vs Immigrants from Cambodia In Labor Force | Age 25-29
COMPARE
Immigrants from Oceania
Immigrants from Cambodia
In Labor Force | Age 25-29
In Labor Force | Age 25-29 Comparison
Immigrants from Oceania
Immigrants from Cambodia
84.2%
IN LABOR FORCE | AGE 25-29
5.0/ 100
METRIC RATING
229th/ 347
METRIC RANK
84.4%
IN LABOR FORCE | AGE 25-29
14.3/ 100
METRIC RATING
206th/ 347
METRIC RANK
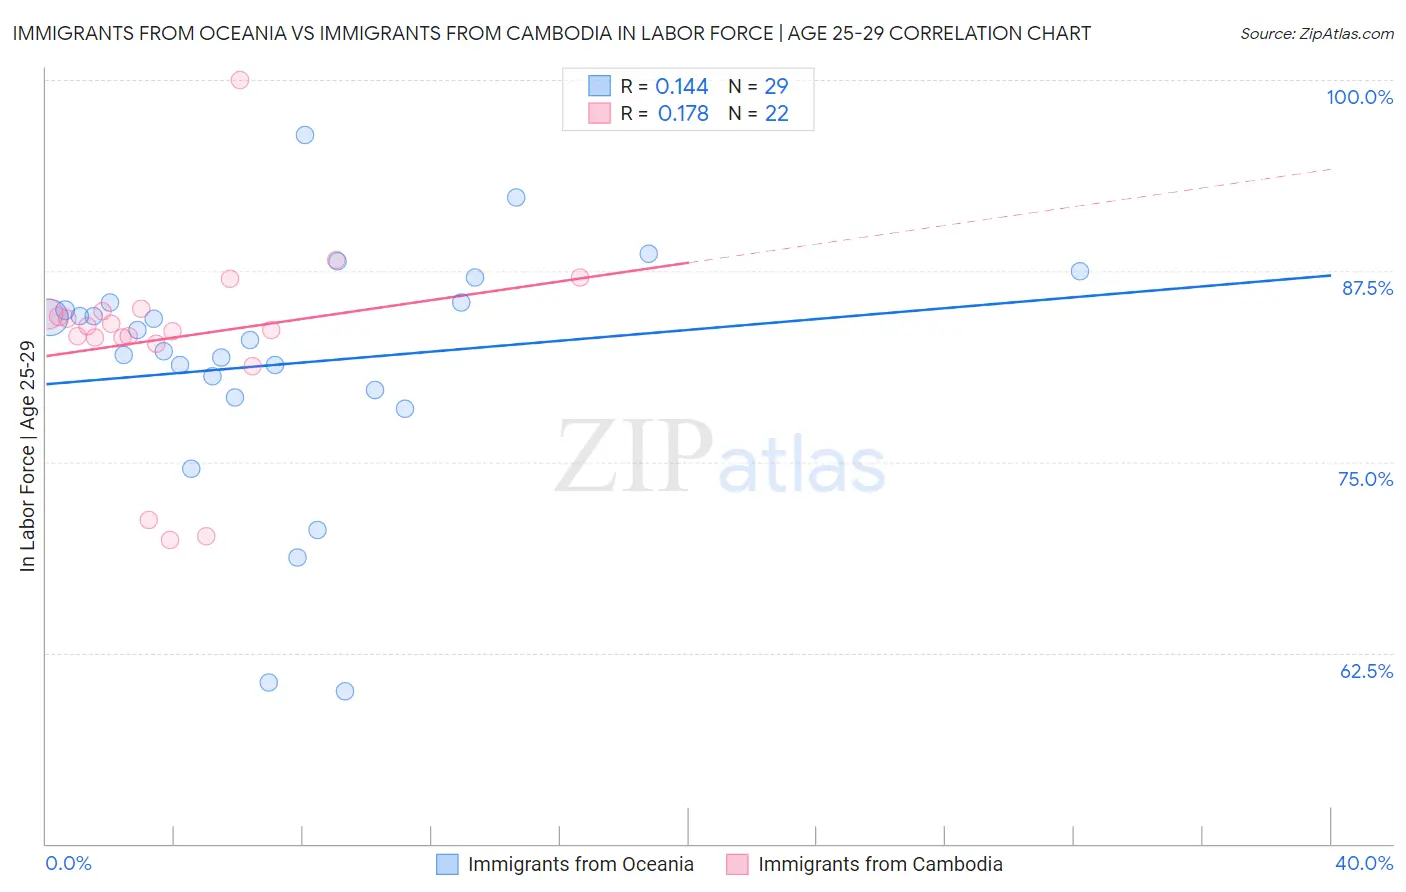
Immigrants from Oceania vs Immigrants from Cambodia In Labor Force | Age 25-29 Correlation Chart
The statistical analysis conducted on geographies consisting of 305,432,144 people shows a poor positive correlation between the proportion of Immigrants from Oceania and labor force participation rate among population between the ages 25 and 29 in the United States with a correlation coefficient (R) of 0.144 and weighted average of 84.2%. Similarly, the statistical analysis conducted on geographies consisting of 205,138,607 people shows a poor positive correlation between the proportion of Immigrants from Cambodia and labor force participation rate among population between the ages 25 and 29 in the United States with a correlation coefficient (R) of 0.178 and weighted average of 84.4%, a difference of 0.22%.
In Labor Force | Age 25-29 Correlation Summary
| Measurement | Immigrants from Oceania | Immigrants from Cambodia |
| Minimum | 60.0% | 69.9% |
| Maximum | 96.4% | 100.0% |
| Range | 36.4% | 30.1% |
| Mean | 81.4% | 83.1% |
| Median | 83.0% | 83.8% |
| Interquartile 25% (IQ1) | 79.5% | 83.2% |
| Interquartile 75% (IQ3) | 85.4% | 84.9% |
| Interquartile Range (IQR) | 6.0% | 1.7% |
| Standard Deviation (Sample) | 8.1% | 6.3% |
| Standard Deviation (Population) | 8.0% | 6.2% |
Similar Demographics by In Labor Force | Age 25-29
Demographics Similar to Immigrants from Oceania by In Labor Force | Age 25-29
In terms of in labor force | age 25-29, the demographic groups most similar to Immigrants from Oceania are White/Caucasian (84.2%, a difference of 0.0%), Immigrants from Philippines (84.2%, a difference of 0.010%), French American Indian (84.2%, a difference of 0.020%), Immigrants from Panama (84.2%, a difference of 0.020%), and Panamanian (84.2%, a difference of 0.020%).
| Demographics | Rating | Rank | In Labor Force | Age 25-29 |
| Jordanians | 6.7 /100 | #222 | Tragic 84.2% |
| Scotch-Irish | 6.5 /100 | #223 | Tragic 84.2% |
| Immigrants | West Indies | 6.0 /100 | #224 | Tragic 84.2% |
| Koreans | 5.9 /100 | #225 | Tragic 84.2% |
| Immigrants | Congo | 5.8 /100 | #226 | Tragic 84.2% |
| French American Indians | 5.5 /100 | #227 | Tragic 84.2% |
| Immigrants | Panama | 5.5 /100 | #228 | Tragic 84.2% |
| Immigrants | Oceania | 5.0 /100 | #229 | Tragic 84.2% |
| Whites/Caucasians | 4.8 /100 | #230 | Tragic 84.2% |
| Immigrants | Philippines | 4.7 /100 | #231 | Tragic 84.2% |
| Panamanians | 4.5 /100 | #232 | Tragic 84.2% |
| Immigrants | Western Asia | 2.7 /100 | #233 | Tragic 84.1% |
| Barbadians | 1.0 /100 | #234 | Tragic 83.9% |
| Iraqis | 0.9 /100 | #235 | Tragic 83.9% |
| Guamanians/Chamorros | 0.9 /100 | #236 | Tragic 83.9% |
Demographics Similar to Immigrants from Cambodia by In Labor Force | Age 25-29
In terms of in labor force | age 25-29, the demographic groups most similar to Immigrants from Cambodia are Venezuelan (84.4%, a difference of 0.010%), Ecuadorian (84.4%, a difference of 0.010%), Afghan (84.4%, a difference of 0.020%), Immigrants from Afghanistan (84.4%, a difference of 0.020%), and Immigrants from Armenia (84.4%, a difference of 0.020%).
| Demographics | Rating | Rank | In Labor Force | Age 25-29 |
| Immigrants | Germany | 18.3 /100 | #199 | Poor 84.4% |
| Immigrants | Kazakhstan | 17.5 /100 | #200 | Poor 84.4% |
| Laotians | 16.6 /100 | #201 | Poor 84.4% |
| Afghans | 15.9 /100 | #202 | Poor 84.4% |
| Immigrants | Afghanistan | 15.6 /100 | #203 | Poor 84.4% |
| Venezuelans | 15.1 /100 | #204 | Poor 84.4% |
| Ecuadorians | 14.8 /100 | #205 | Poor 84.4% |
| Immigrants | Cambodia | 14.3 /100 | #206 | Poor 84.4% |
| Immigrants | Armenia | 13.3 /100 | #207 | Poor 84.4% |
| Immigrants | Indonesia | 13.2 /100 | #208 | Poor 84.4% |
| Immigrants | Jordan | 12.8 /100 | #209 | Poor 84.4% |
| Chinese | 12.7 /100 | #210 | Poor 84.3% |
| Immigrants | Venezuela | 12.6 /100 | #211 | Poor 84.3% |
| Sub-Saharan Africans | 11.7 /100 | #212 | Poor 84.3% |
| Japanese | 11.4 /100 | #213 | Poor 84.3% |