Spanish American Indian vs Immigrants from Cambodia Vision Disability
COMPARE
Spanish American Indian
Immigrants from Cambodia
Vision Disability
Vision Disability Comparison
Spanish American Indians
Immigrants from Cambodia
2.6%
VISION DISABILITY
0.0/ 100
METRIC RATING
302nd/ 347
METRIC RANK
2.3%
VISION DISABILITY
1.1/ 100
METRIC RATING
238th/ 347
METRIC RANK
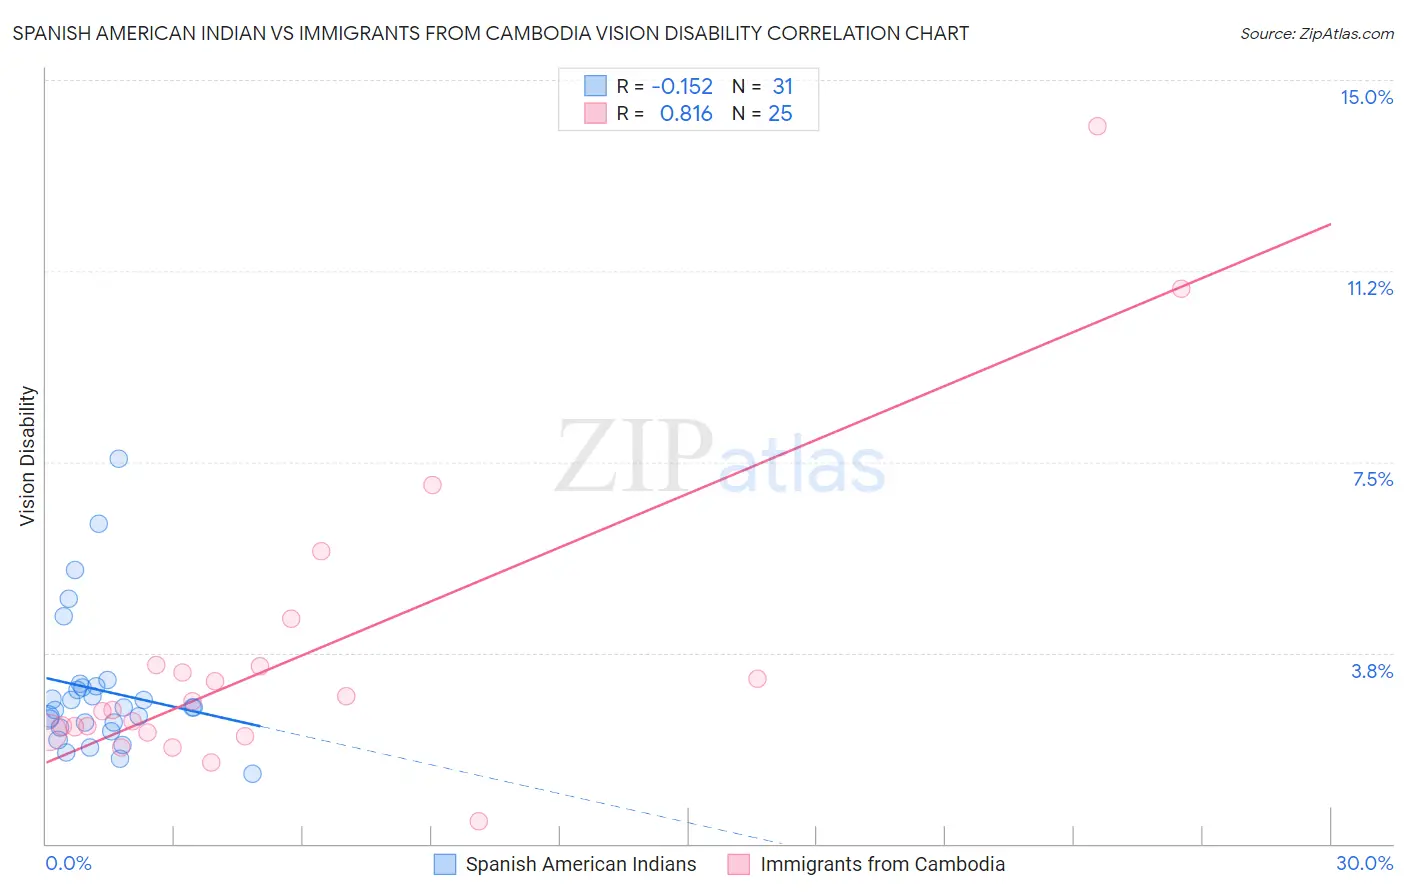
Spanish American Indian vs Immigrants from Cambodia Vision Disability Correlation Chart
The statistical analysis conducted on geographies consisting of 73,139,159 people shows a poor negative correlation between the proportion of Spanish American Indians and percentage of population with vision disability in the United States with a correlation coefficient (R) of -0.152 and weighted average of 2.6%. Similarly, the statistical analysis conducted on geographies consisting of 205,117,517 people shows a very strong positive correlation between the proportion of Immigrants from Cambodia and percentage of population with vision disability in the United States with a correlation coefficient (R) of 0.816 and weighted average of 2.3%, a difference of 11.1%.
Vision Disability Correlation Summary
| Measurement | Spanish American Indian | Immigrants from Cambodia |
| Minimum | 1.4% | 0.43% |
| Maximum | 7.6% | 14.1% |
| Range | 6.2% | 13.7% |
| Mean | 3.0% | 3.7% |
| Median | 2.7% | 2.6% |
| Interquartile 25% (IQ1) | 2.3% | 2.2% |
| Interquartile 75% (IQ3) | 3.1% | 3.5% |
| Interquartile Range (IQR) | 0.83% | 1.3% |
| Standard Deviation (Sample) | 1.4% | 3.0% |
| Standard Deviation (Population) | 1.3% | 2.9% |
Similar Demographics by Vision Disability
Demographics Similar to Spanish American Indians by Vision Disability
In terms of vision disability, the demographic groups most similar to Spanish American Indians are Immigrants from Cabo Verde (2.6%, a difference of 0.22%), Aleut (2.6%, a difference of 0.36%), Hispanic or Latino (2.6%, a difference of 0.66%), Menominee (2.5%, a difference of 1.3%), and Iroquois (2.6%, a difference of 1.3%).
| Demographics | Rating | Rank | Vision Disability |
| Delaware | 0.0 /100 | #295 | Tragic 2.5% |
| Immigrants | Mexico | 0.0 /100 | #296 | Tragic 2.5% |
| Immigrants | Dominica | 0.0 /100 | #297 | Tragic 2.5% |
| Mexicans | 0.0 /100 | #298 | Tragic 2.5% |
| Cree | 0.0 /100 | #299 | Tragic 2.5% |
| Africans | 0.0 /100 | #300 | Tragic 2.5% |
| Menominee | 0.0 /100 | #301 | Tragic 2.5% |
| Spanish American Indians | 0.0 /100 | #302 | Tragic 2.6% |
| Immigrants | Cabo Verde | 0.0 /100 | #303 | Tragic 2.6% |
| Aleuts | 0.0 /100 | #304 | Tragic 2.6% |
| Hispanics or Latinos | 0.0 /100 | #305 | Tragic 2.6% |
| Iroquois | 0.0 /100 | #306 | Tragic 2.6% |
| Immigrants | Dominican Republic | 0.0 /100 | #307 | Tragic 2.6% |
| Arapaho | 0.0 /100 | #308 | Tragic 2.6% |
| Immigrants | Yemen | 0.0 /100 | #309 | Tragic 2.6% |
Demographics Similar to Immigrants from Cambodia by Vision Disability
In terms of vision disability, the demographic groups most similar to Immigrants from Cambodia are English (2.3%, a difference of 0.020%), Immigrants from Portugal (2.3%, a difference of 0.27%), Panamanian (2.3%, a difference of 0.27%), Malaysian (2.3%, a difference of 0.30%), and Immigrants from Congo (2.3%, a difference of 0.32%).
| Demographics | Rating | Rank | Vision Disability |
| Immigrants | Ecuador | 2.0 /100 | #231 | Tragic 2.3% |
| German Russians | 1.8 /100 | #232 | Tragic 2.3% |
| Central Americans | 1.8 /100 | #233 | Tragic 2.3% |
| Scottish | 1.6 /100 | #234 | Tragic 2.3% |
| Marshallese | 1.5 /100 | #235 | Tragic 2.3% |
| Immigrants | Congo | 1.4 /100 | #236 | Tragic 2.3% |
| Immigrants | Portugal | 1.4 /100 | #237 | Tragic 2.3% |
| Immigrants | Cambodia | 1.1 /100 | #238 | Tragic 2.3% |
| English | 1.1 /100 | #239 | Tragic 2.3% |
| Panamanians | 0.9 /100 | #240 | Tragic 2.3% |
| Malaysians | 0.9 /100 | #241 | Tragic 2.3% |
| Immigrants | Panama | 0.8 /100 | #242 | Tragic 2.3% |
| Immigrants | Nicaragua | 0.6 /100 | #243 | Tragic 2.3% |
| Immigrants | West Indies | 0.6 /100 | #244 | Tragic 2.3% |
| Alsatians | 0.6 /100 | #245 | Tragic 2.3% |