Soviet Union vs Immigrants from Taiwan In Labor Force | Age 20-64
COMPARE
Soviet Union
Immigrants from Taiwan
In Labor Force | Age 20-64
In Labor Force | Age 20-64 Comparison
Soviet Union
Immigrants from Taiwan
80.2%
IN LABOR FORCE | AGE 20-64
98.5/ 100
METRIC RATING
71st/ 347
METRIC RANK
80.0%
IN LABOR FORCE | AGE 20-64
92.5/ 100
METRIC RATING
119th/ 347
METRIC RANK
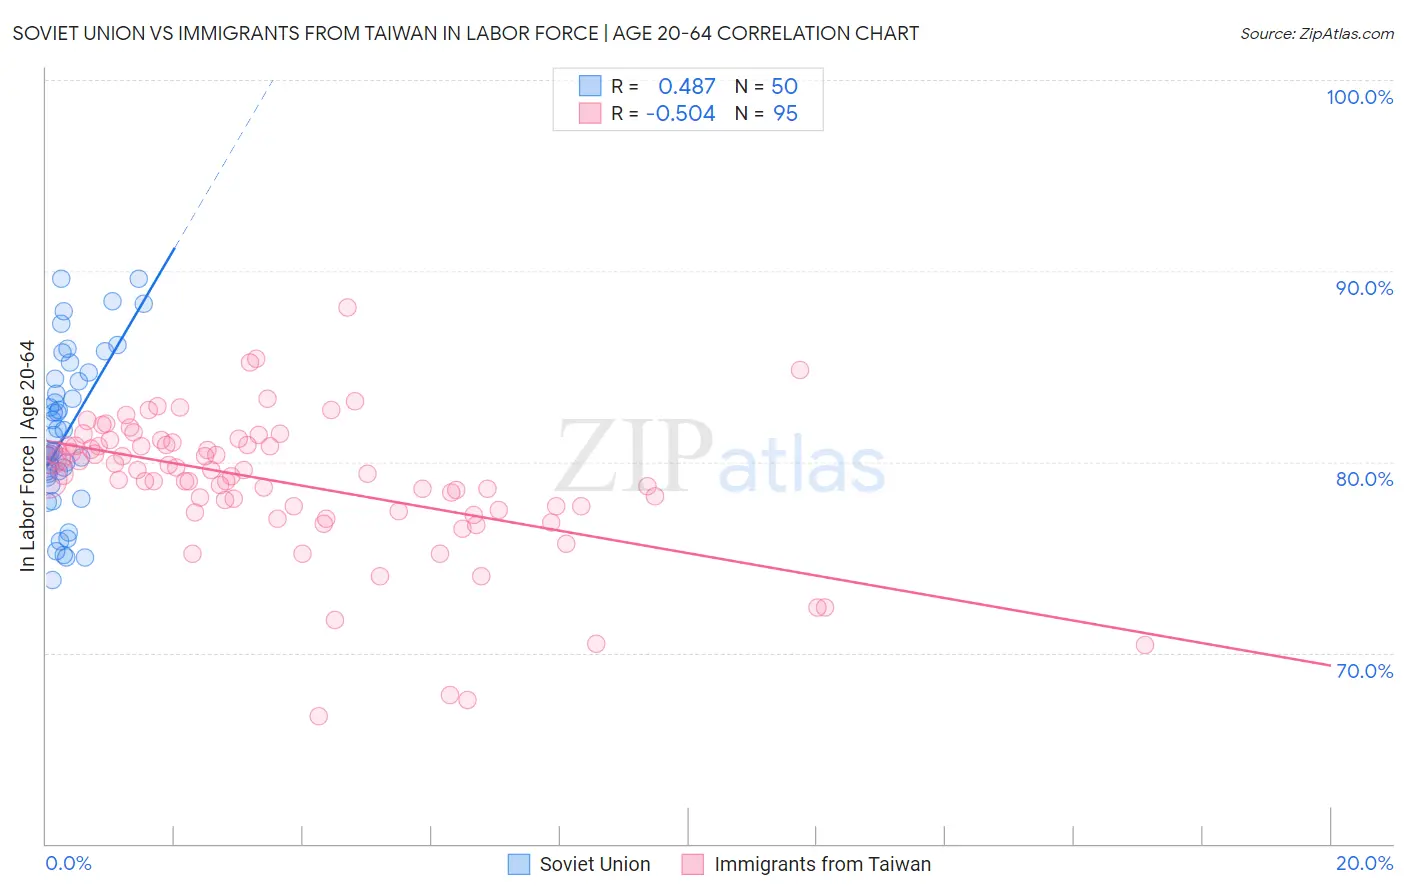
Soviet Union vs Immigrants from Taiwan In Labor Force | Age 20-64 Correlation Chart
The statistical analysis conducted on geographies consisting of 43,514,626 people shows a moderate positive correlation between the proportion of Soviet Union and labor force participation rate among population between the ages 20 and 64 in the United States with a correlation coefficient (R) of 0.487 and weighted average of 80.2%. Similarly, the statistical analysis conducted on geographies consisting of 298,293,135 people shows a substantial negative correlation between the proportion of Immigrants from Taiwan and labor force participation rate among population between the ages 20 and 64 in the United States with a correlation coefficient (R) of -0.504 and weighted average of 80.0%, a difference of 0.33%.
In Labor Force | Age 20-64 Correlation Summary
| Measurement | Soviet Union | Immigrants from Taiwan |
| Minimum | 73.8% | 66.7% |
| Maximum | 89.6% | 88.1% |
| Range | 15.8% | 21.4% |
| Mean | 81.5% | 78.9% |
| Median | 81.0% | 79.4% |
| Interquartile 25% (IQ1) | 79.2% | 77.5% |
| Interquartile 75% (IQ3) | 84.3% | 80.9% |
| Interquartile Range (IQR) | 5.1% | 3.4% |
| Standard Deviation (Sample) | 4.1% | 3.7% |
| Standard Deviation (Population) | 4.1% | 3.7% |
Similar Demographics by In Labor Force | Age 20-64
Demographics Similar to Soviet Union by In Labor Force | Age 20-64
In terms of in labor force | age 20-64, the demographic groups most similar to Soviet Union are Bhutanese (80.2%, a difference of 0.010%), Albanian (80.2%, a difference of 0.010%), Immigrants from Turkey (80.2%, a difference of 0.010%), Eastern European (80.2%, a difference of 0.010%), and Macedonian (80.2%, a difference of 0.020%).
| Demographics | Rating | Rank | In Labor Force | Age 20-64 |
| Immigrants | Albania | 98.7 /100 | #64 | Exceptional 80.3% |
| Lithuanians | 98.7 /100 | #65 | Exceptional 80.2% |
| Macedonians | 98.7 /100 | #66 | Exceptional 80.2% |
| Taiwanese | 98.6 /100 | #67 | Exceptional 80.2% |
| Bhutanese | 98.6 /100 | #68 | Exceptional 80.2% |
| Albanians | 98.6 /100 | #69 | Exceptional 80.2% |
| Immigrants | Turkey | 98.5 /100 | #70 | Exceptional 80.2% |
| Soviet Union | 98.5 /100 | #71 | Exceptional 80.2% |
| Eastern Europeans | 98.4 /100 | #72 | Exceptional 80.2% |
| Cypriots | 98.2 /100 | #73 | Exceptional 80.2% |
| Immigrants | Eastern Europe | 98.1 /100 | #74 | Exceptional 80.2% |
| Immigrants | Afghanistan | 97.9 /100 | #75 | Exceptional 80.2% |
| Egyptians | 97.8 /100 | #76 | Exceptional 80.2% |
| Immigrants | Colombia | 97.8 /100 | #77 | Exceptional 80.2% |
| Immigrants | Romania | 97.8 /100 | #78 | Exceptional 80.2% |
Demographics Similar to Immigrants from Taiwan by In Labor Force | Age 20-64
In terms of in labor force | age 20-64, the demographic groups most similar to Immigrants from Taiwan are Maltese (80.0%, a difference of 0.0%), Immigrants from Vietnam (80.0%, a difference of 0.010%), Cape Verdean (80.0%, a difference of 0.010%), Immigrants from Kuwait (80.0%, a difference of 0.010%), and Mongolian (79.9%, a difference of 0.010%).
| Demographics | Rating | Rank | In Labor Force | Age 20-64 |
| Immigrants | Italy | 93.9 /100 | #112 | Exceptional 80.0% |
| Sri Lankans | 93.9 /100 | #113 | Exceptional 80.0% |
| Argentineans | 93.8 /100 | #114 | Exceptional 80.0% |
| Bermudans | 93.3 /100 | #115 | Exceptional 80.0% |
| Immigrants | Western Africa | 93.1 /100 | #116 | Exceptional 80.0% |
| Immigrants | Vietnam | 92.7 /100 | #117 | Exceptional 80.0% |
| Cape Verdeans | 92.7 /100 | #118 | Exceptional 80.0% |
| Immigrants | Taiwan | 92.5 /100 | #119 | Exceptional 80.0% |
| Maltese | 92.4 /100 | #120 | Exceptional 80.0% |
| Immigrants | Kuwait | 92.2 /100 | #121 | Exceptional 80.0% |
| Mongolians | 92.0 /100 | #122 | Exceptional 79.9% |
| Immigrants | Russia | 91.8 /100 | #123 | Exceptional 79.9% |
| Immigrants | Europe | 91.6 /100 | #124 | Exceptional 79.9% |
| Danes | 91.5 /100 | #125 | Exceptional 79.9% |
| Immigrants | France | 90.7 /100 | #126 | Exceptional 79.9% |