Barbadian vs Immigrants from Taiwan In Labor Force | Age 20-64

COMPARE

Barbadian
Race
Ancestry
AfghanAfricanAlaska NativeAlaskan AthabascanAlbanianAleutAlsatianAmericanApacheArabArapahoArgentineanArmenianAssyrian/Chaldean/SyriacAustralianAustrianBahamianBangladeshiBarbadianBasqueBelgianBelizeanBermudanBhutaneseBlackfeetBolivianBrazilianBritishBritish West IndianBulgarianBurmeseCajunCambodianCanadianCape VerdeanCarpatho RusynCelticCentral AmericanCentral American IndianCherokeeCheyenneChickasawChileanChineseChippewaChoctawColombianColvilleComancheCosta RicanCreeCreekCroatianCrowCubanCypriotCzechCzechoslovakianDanishDelawareDominicanDutchDutch West IndianEastern EuropeanEcuadorianEgyptianEnglishEstonianEthiopianEuropeanFijianFilipinoFinnishFrenchFrench American IndianFrench CanadianGermanGerman RussianGhanaianGreekGuamanian/ChamorroGuatemalanGuyaneseHaitianHmongHonduranHopiHoumaHungarianIcelanderIndian (Asian)IndonesianInupiatIranianIraqiIrishIroquoisIsraeliItalianJamaicanJapaneseJordanianKenyanKiowaKoreanLaotianLatvianLebaneseLiberianLithuanianLumbeeLuxembourgerMacedonianMalaysianMalteseMarshalleseMenomineeMexicanMexican American IndianMongolianMoroccanNative HawaiianNavajoNepaleseNew ZealanderNicaraguanNigerianNorthern EuropeanNorwegianOkinawanOsageOttawaPaiutePakistaniPalestinianPanamanianParaguayanPennsylvania GermanPeruvianPimaPolishPortuguesePotawatomiPuebloPuerto RicanPuget Sound SalishRomanianRussianSalvadoranSamoanScandinavianScotch-IrishScottishSeminoleSenegaleseSerbianShoshoneSierra LeoneanSiouxSlavicSlovakSloveneSomaliSouth AfricanSouth AmericanSouth American IndianSoviet UnionSpaniardSpanishSpanish AmericanSpanish American IndianSri LankanSubsaharan AfricanSudaneseSwedishSwissSyrianTaiwaneseThaiTlingit-HaidaTohono O'OdhamTonganTrinidadian and TobagonianTsimshianTurkishU.S. Virgin IslanderUgandanUkrainianUruguayanUteVenezuelanVietnameseWelshWest IndianYakamaYaquiYugoslavianYumanYup'ikZimbabwean
Immigration
NonimmigrantsImmigrantsAfghanistanAfricaAlbaniaArgentinaArmeniaAsiaAustraliaAustriaBahamasBangladeshBarbadosBelarusBelgiumBelizeBoliviaBosnia and HerzegovinaBrazilBulgariaBurma/MyanmarCabo VerdeCambodiaCameroonCanadaCaribbeanCentral AmericaChileChinaColombiaCongoCosta RicaCroatiaCubaCzechoslovakiaDenmarkDominicaDominican RepublicEastern AfricaEastern AsiaEastern EuropeEcuadorEgyptEl SalvadorEnglandEritreaEthiopiaEuropeFijiFranceGermanyGhanaGreeceGrenadaGuatemalaGuyanaHaitiHondurasHong KongHungaryIndiaIndonesiaIranIraqIrelandIsraelItalyJamaicaJapanJordanKazakhstanKenyaKoreaKuwaitLaosLatin AmericaLatviaLebanonLiberiaLithuaniaMalaysiaMexicoMicronesiaMiddle AfricaMoldovaMoroccoNepalNetherlandsNicaraguaNigeriaNorth AmericaNorth MacedoniaNorthern AfricaNorthern EuropeNorwayOceaniaPakistanPanamaPeruPhilippinesPolandPortugalRomaniaRussiaSaudi ArabiaScotlandSenegalSerbiaSierra LeoneSingaporeSomaliaSouth AfricaSouth AmericaSouth Central AsiaSouth Eastern AsiaSouthern EuropeSpainSri LankaSt. Vincent and the GrenadinesSudanSwedenSwitzerlandSyriaThailandTrinidad and TobagoTurkeyUgandaUkraineUruguayUzbekistanVenezuelaVietnamWest IndiesWestern AfricaWestern AsiaWestern EuropeYemenZaireZimbabweAzores
Immigrants from Taiwan
Race
Ancestry
AfghanAfricanAlaska NativeAlaskan AthabascanAlbanianAleutAlsatianAmericanApacheArabArapahoArgentineanArmenianAssyrian/Chaldean/SyriacAustralianAustrianBahamianBangladeshiBasqueBelgianBelizeanBermudanBhutaneseBlackfeetBolivianBrazilianBritishBritish West IndianBulgarianBurmeseCajunCambodianCanadianCape VerdeanCarpatho RusynCelticCentral AmericanCentral American IndianCherokeeCheyenneChickasawChileanChineseChippewaChoctawColombianColvilleComancheCosta RicanCreeCreekCroatianCrowCubanCypriotCzechCzechoslovakianDanishDelawareDominicanDutchDutch West IndianEastern EuropeanEcuadorianEgyptianEnglishEstonianEthiopianEuropeanFijianFilipinoFinnishFrenchFrench American IndianFrench CanadianGermanGerman RussianGhanaianGreekGuamanian/ChamorroGuatemalanGuyaneseHaitianHmongHonduranHopiHoumaHungarianIcelanderIndian (Asian)IndonesianInupiatIranianIraqiIrishIroquoisIsraeliItalianJamaicanJapaneseJordanianKenyanKiowaKoreanLaotianLatvianLebaneseLiberianLithuanianLumbeeLuxembourgerMacedonianMalaysianMalteseMarshalleseMenomineeMexicanMexican American IndianMongolianMoroccanNative HawaiianNavajoNepaleseNew ZealanderNicaraguanNigerianNorthern EuropeanNorwegianOkinawanOsageOttawaPaiutePakistaniPalestinianPanamanianParaguayanPennsylvania GermanPeruvianPimaPolishPortuguesePotawatomiPuebloPuerto RicanPuget Sound SalishRomanianRussianSalvadoranSamoanScandinavianScotch-IrishScottishSeminoleSenegaleseSerbianShoshoneSierra LeoneanSiouxSlavicSlovakSloveneSomaliSouth AfricanSouth AmericanSouth American IndianSoviet UnionSpaniardSpanishSpanish AmericanSpanish American IndianSri LankanSubsaharan AfricanSudaneseSwedishSwissSyrianTaiwaneseThaiTlingit-HaidaTohono O'OdhamTonganTrinidadian and TobagonianTsimshianTurkishU.S. Virgin IslanderUgandanUkrainianUruguayanUteVenezuelanVietnameseWelshWest IndianYakamaYaquiYugoslavianYumanYup'ikZimbabwean
Immigration
NonimmigrantsImmigrantsAfghanistanAfricaAlbaniaArgentinaArmeniaAsiaAustraliaAustriaBahamasBangladeshBarbadosBelarusBelgiumBelizeBoliviaBosnia and HerzegovinaBrazilBulgariaBurma/MyanmarCabo VerdeCambodiaCameroonCanadaCaribbeanCentral AmericaChileChinaColombiaCongoCosta RicaCroatiaCubaCzechoslovakiaDenmarkDominicaDominican RepublicEastern AfricaEastern AsiaEastern EuropeEcuadorEgyptEl SalvadorEnglandEritreaEthiopiaEuropeFijiFranceGermanyGhanaGreeceGrenadaGuatemalaGuyanaHaitiHondurasHong KongHungaryIndiaIndonesiaIranIraqIrelandIsraelItalyJamaicaJapanJordanKazakhstanKenyaKoreaKuwaitLaosLatin AmericaLatviaLebanonLiberiaLithuaniaMalaysiaMexicoMicronesiaMiddle AfricaMoldovaMoroccoNepalNetherlandsNicaraguaNigeriaNorth AmericaNorth MacedoniaNorthern AfricaNorthern EuropeNorwayOceaniaPakistanPanamaPeruPhilippinesPolandPortugalRomaniaRussiaSaudi ArabiaScotlandSenegalSerbiaSierra LeoneSingaporeSomaliaSouth AfricaSouth AmericaSouth Central AsiaSouth Eastern AsiaSouthern EuropeSpainSri LankaSt. Vincent and the GrenadinesSudanSwedenSwitzerlandSyriaTaiwanThailandTrinidad and TobagoTurkeyUgandaUkraineUruguayUzbekistanVenezuelaVietnamWest IndiesWestern AfricaWestern AsiaWestern EuropeYemenZaireZimbabweAzores
In Labor Force | Age 20-64
Income
Poverty
Unemployment
Labor Participation
Family Structure
Vehicle Availability
Education Level
Disability

In Labor Force | Age 20-64 Comparison

Barbadians

Immigrants from Taiwan

Tragic
Exceptional
78.8%
IN LABOR FORCE | AGE 20-64
0.7/ 100
METRIC RATING
251st/ 347
METRIC RANK
80.0%
IN LABOR FORCE | AGE 20-64
92.5/ 100
METRIC RATING
119th/ 347
METRIC RANK

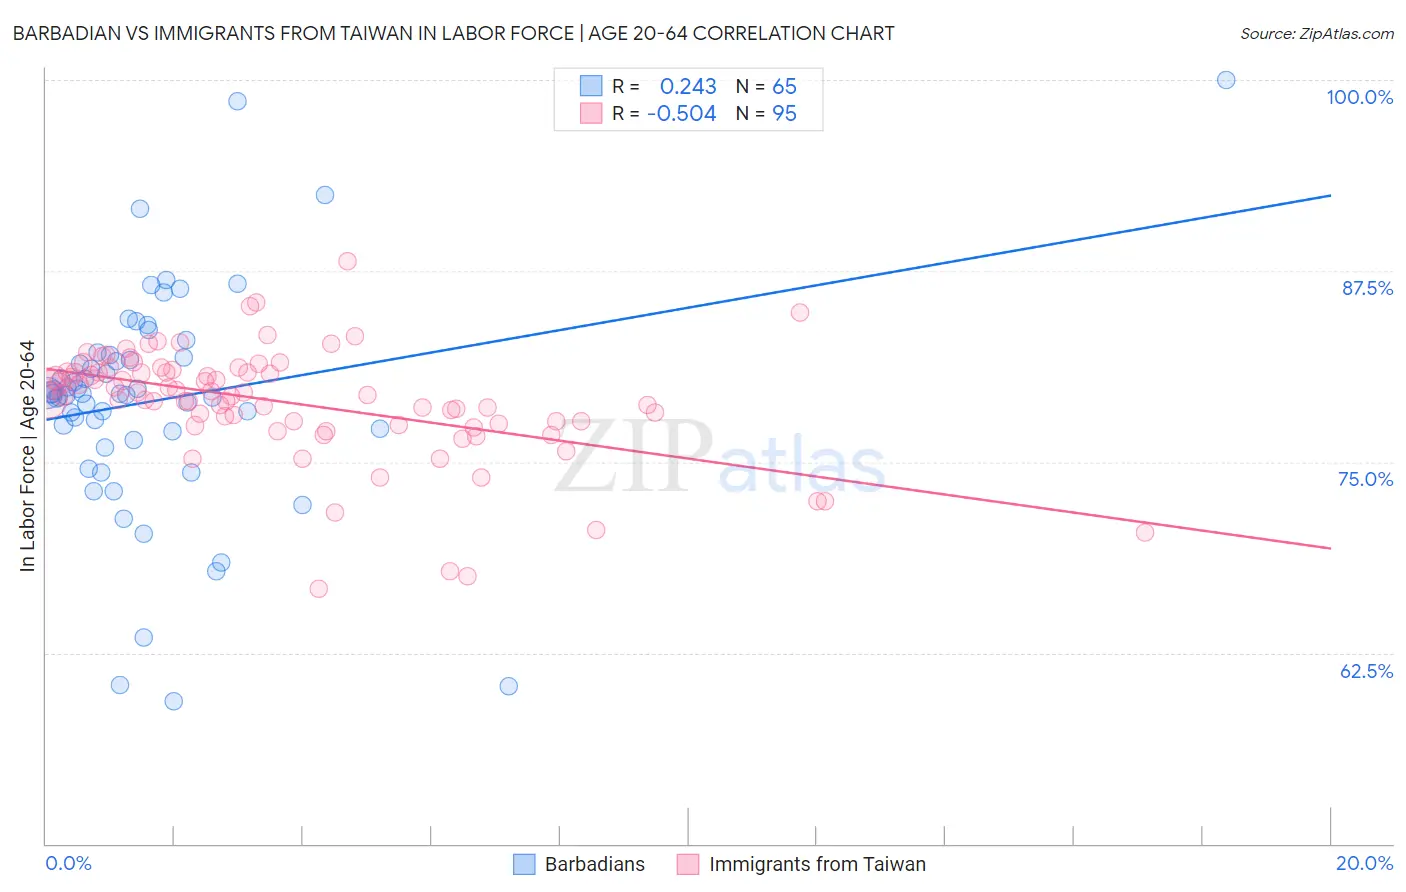
Barbadian vs Immigrants from Taiwan In Labor Force | Age 20-64 Correlation Chart

The statistical analysis conducted on geographies consisting of 141,304,311 people shows a weak positive correlation between the proportion of Barbadians and labor force participation rate among population between the ages 20 and 64 in the United States with a correlation coefficient (R) of 0.243 and weighted average of 78.8%. Similarly, the statistical analysis conducted on geographies consisting of 298,293,135 people shows a substantial negative correlation between the proportion of Immigrants from Taiwan and labor force participation rate among population between the ages 20 and 64 in the United States with a correlation coefficient (R) of -0.504 and weighted average of 80.0%, a difference of 1.5%.
Barbadian vs Immigrants from Taiwan In Labor Force | Age 20-64

In Labor Force | Age 20-64 Correlation Summary

MeasurementBarbadianImmigrants from Taiwan
Minimum59.3%66.7%
Maximum100.0%88.1%
Range40.7%21.4%
Mean79.0%78.9%
Median79.4%79.4%
Interquartile 25% (IQ1)76.7%77.5%
Interquartile 75% (IQ3)81.9%80.9%
Interquartile Range (IQR)5.2%3.4%
Standard Deviation (Sample)7.4%3.7%
Standard Deviation (Population)7.4%3.7%

Similar Demographics by In Labor Force | Age 20-64

Demographics Similar to Barbadians by In Labor Force | Age 20-64

In terms of in labor force | age 20-64, the demographic groups most similar to Barbadians are English (78.8%, a difference of 0.030%), Honduran (78.8%, a difference of 0.030%), Immigrants from Honduras (78.7%, a difference of 0.050%), Immigrants from Germany (78.8%, a difference of 0.060%), and Immigrants from Caribbean (78.8%, a difference of 0.060%).
DemographicsRating | RankIn Labor Force | Age 20-64
French
1.5
/100
|
#244
Tragic
78.9%
Scottish
1.3
/100
|
#245
Tragic
78.9%
Immigrants | Trinidad and Tobago
1.1
/100
|
#246
Tragic
78.8%
Immigrants | Germany
1.0
/100
|
#247
Tragic
78.8%
Immigrants | Caribbean
1.0
/100
|
#248
Tragic
78.8%
English
0.9
/100
|
#249
Tragic
78.8%
Hondurans
0.8
/100
|
#250
Tragic
78.8%
Barbadians
0.7
/100
|
#251
Tragic
78.8%
Immigrants | Honduras
0.6
/100
|
#252
Tragic
78.7%
Basques
0.5
/100
|
#253
Tragic
78.7%
Immigrants | Lebanon
0.5
/100
|
#254
Tragic
78.7%
Hawaiians
0.5
/100
|
#255
Tragic
78.7%
Celtics
0.5
/100
|
#256
Tragic
78.7%
Guatemalans
0.4
/100
|
#257
Tragic
78.7%
Immigrants | Guatemala
0.4
/100
|
#258
Tragic
78.7%

Demographics Similar to Immigrants from Taiwan by In Labor Force | Age 20-64

In terms of in labor force | age 20-64, the demographic groups most similar to Immigrants from Taiwan are Maltese (80.0%, a difference of 0.0%), Immigrants from Vietnam (80.0%, a difference of 0.010%), Cape Verdean (80.0%, a difference of 0.010%), Immigrants from Kuwait (80.0%, a difference of 0.010%), and Mongolian (79.9%, a difference of 0.010%).
DemographicsRating | RankIn Labor Force | Age 20-64
Immigrants | Italy
93.9
/100
|
#112
Exceptional
80.0%
Sri Lankans
93.9
/100
|
#113
Exceptional
80.0%
Argentineans
93.8
/100
|
#114
Exceptional
80.0%
Bermudans
93.3
/100
|
#115
Exceptional
80.0%
Immigrants | Western Africa
93.1
/100
|
#116
Exceptional
80.0%
Immigrants | Vietnam
92.7
/100
|
#117
Exceptional
80.0%
Cape Verdeans
92.7
/100
|
#118
Exceptional
80.0%
Immigrants | Taiwan
92.5
/100
|
#119
Exceptional
80.0%
Maltese
92.4
/100
|
#120
Exceptional
80.0%
Immigrants | Kuwait
92.2
/100
|
#121
Exceptional
80.0%
Mongolians
92.0
/100
|
#122
Exceptional
79.9%
Immigrants | Russia
91.8
/100
|
#123
Exceptional
79.9%
Immigrants | Europe
91.6
/100
|
#124
Exceptional
79.9%
Danes
91.5
/100
|
#125
Exceptional
79.9%
Immigrants | France
90.7
/100
|
#126
Exceptional
79.9%