Soviet Union vs Immigrants from Taiwan Unemployment Among Ages 30 to 34 years
COMPARE
Soviet Union
Immigrants from Taiwan
Unemployment Among Ages 30 to 34 years
Unemployment Among Ages 30 to 34 years Comparison
Soviet Union
Immigrants from Taiwan
5.0%
UNEMPLOYMENT AMONG AGES 30 TO 34 YEARS
98.8/ 100
METRIC RATING
43rd/ 347
METRIC RANK
4.9%
UNEMPLOYMENT AMONG AGES 30 TO 34 YEARS
99.8/ 100
METRIC RATING
20th/ 347
METRIC RANK
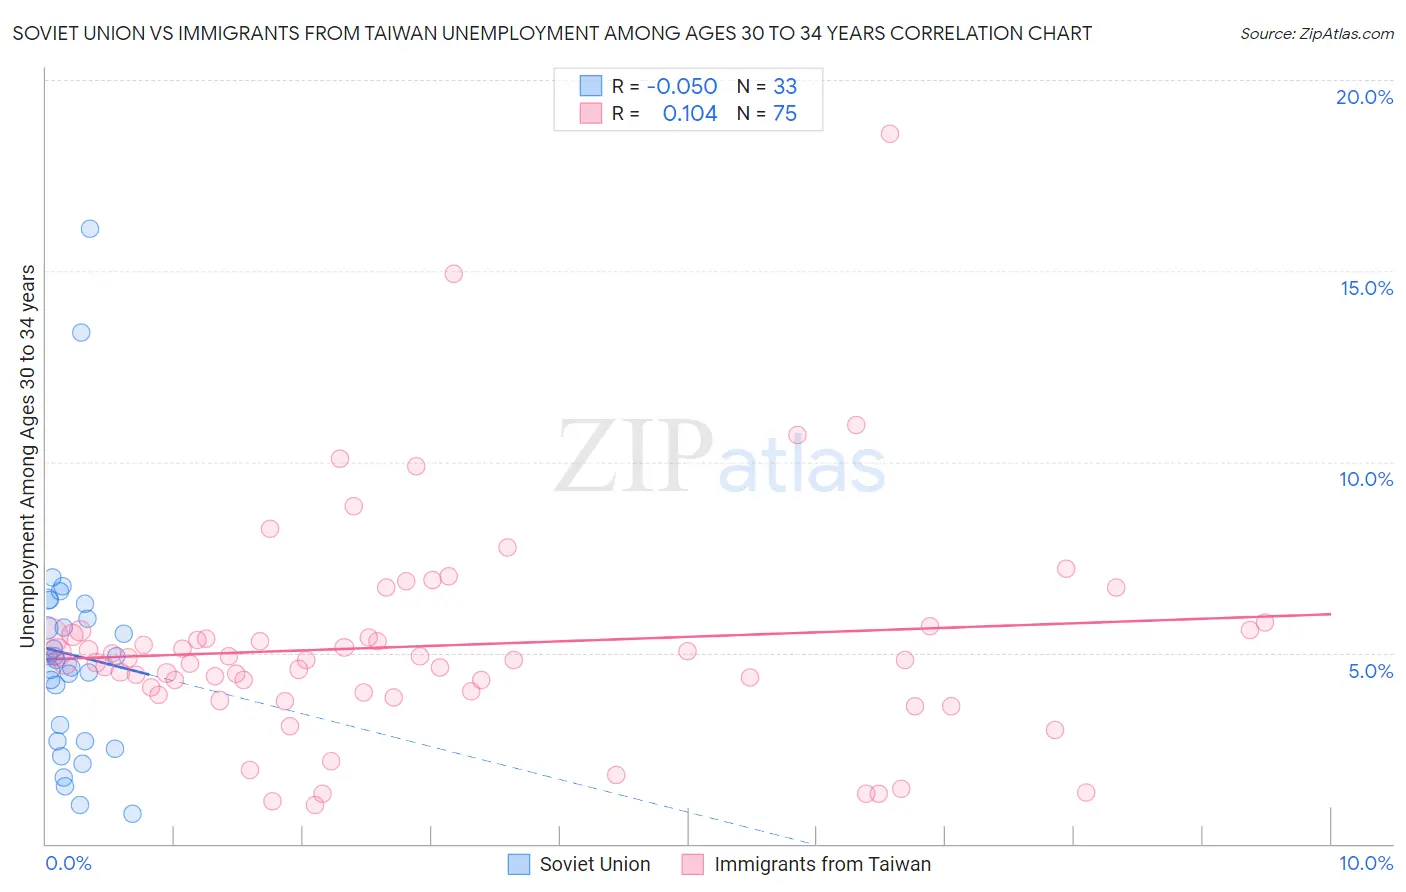
Soviet Union vs Immigrants from Taiwan Unemployment Among Ages 30 to 34 years Correlation Chart
The statistical analysis conducted on geographies consisting of 43,078,343 people shows a slight negative correlation between the proportion of Soviet Union and unemployment rate among population between the ages 30 and 34 in the United States with a correlation coefficient (R) of -0.050 and weighted average of 5.0%. Similarly, the statistical analysis conducted on geographies consisting of 285,904,968 people shows a poor positive correlation between the proportion of Immigrants from Taiwan and unemployment rate among population between the ages 30 and 34 in the United States with a correlation coefficient (R) of 0.104 and weighted average of 4.9%, a difference of 3.8%.
Unemployment Among Ages 30 to 34 years Correlation Summary
| Measurement | Soviet Union | Immigrants from Taiwan |
| Minimum | 0.80% | 1.0% |
| Maximum | 16.1% | 18.6% |
| Range | 15.3% | 17.6% |
| Mean | 4.9% | 5.2% |
| Median | 4.8% | 4.8% |
| Interquartile 25% (IQ1) | 2.7% | 4.0% |
| Interquartile 75% (IQ3) | 6.1% | 5.6% |
| Interquartile Range (IQR) | 3.4% | 1.6% |
| Standard Deviation (Sample) | 3.1% | 2.9% |
| Standard Deviation (Population) | 3.0% | 2.8% |
Similar Demographics by Unemployment Among Ages 30 to 34 years
Demographics Similar to Soviet Union by Unemployment Among Ages 30 to 34 years
In terms of unemployment among ages 30 to 34 years, the demographic groups most similar to Soviet Union are Immigrants from Hong Kong (5.0%, a difference of 0.10%), Immigrants from Belgium (5.1%, a difference of 0.14%), Yugoslavian (5.1%, a difference of 0.17%), Immigrants from Vietnam (5.0%, a difference of 0.28%), and Immigrants from Eastern Africa (5.0%, a difference of 0.28%).
| Demographics | Rating | Rank | Unemployment Among Ages 30 to 34 years |
| Czechs | 99.2 /100 | #36 | Exceptional 5.0% |
| Immigrants | Turkey | 99.0 /100 | #37 | Exceptional 5.0% |
| Sri Lankans | 99.0 /100 | #38 | Exceptional 5.0% |
| Fijians | 99.0 /100 | #39 | Exceptional 5.0% |
| Immigrants | Vietnam | 98.9 /100 | #40 | Exceptional 5.0% |
| Immigrants | Eastern Africa | 98.9 /100 | #41 | Exceptional 5.0% |
| Immigrants | Hong Kong | 98.8 /100 | #42 | Exceptional 5.0% |
| Soviet Union | 98.8 /100 | #43 | Exceptional 5.0% |
| Immigrants | Belgium | 98.7 /100 | #44 | Exceptional 5.1% |
| Yugoslavians | 98.6 /100 | #45 | Exceptional 5.1% |
| Immigrants | Congo | 98.4 /100 | #46 | Exceptional 5.1% |
| Cypriots | 98.4 /100 | #47 | Exceptional 5.1% |
| Assyrians/Chaldeans/Syriacs | 98.4 /100 | #48 | Exceptional 5.1% |
| Immigrants | Malaysia | 98.3 /100 | #49 | Exceptional 5.1% |
| Puget Sound Salish | 98.2 /100 | #50 | Exceptional 5.1% |
Demographics Similar to Immigrants from Taiwan by Unemployment Among Ages 30 to 34 years
In terms of unemployment among ages 30 to 34 years, the demographic groups most similar to Immigrants from Taiwan are Ethiopian (4.9%, a difference of 0.010%), Immigrants from Sudan (4.9%, a difference of 0.020%), Bolivian (4.9%, a difference of 0.080%), Immigrants from South Central Asia (4.9%, a difference of 0.22%), and Hmong (4.9%, a difference of 0.39%).
| Demographics | Rating | Rank | Unemployment Among Ages 30 to 34 years |
| Cambodians | 99.9 /100 | #13 | Exceptional 4.8% |
| Luxembourgers | 99.9 /100 | #14 | Exceptional 4.8% |
| Okinawans | 99.9 /100 | #15 | Exceptional 4.8% |
| Zimbabweans | 99.9 /100 | #16 | Exceptional 4.8% |
| Immigrants | Bulgaria | 99.9 /100 | #17 | Exceptional 4.8% |
| Bolivians | 99.8 /100 | #18 | Exceptional 4.9% |
| Immigrants | Sudan | 99.8 /100 | #19 | Exceptional 4.9% |
| Immigrants | Taiwan | 99.8 /100 | #20 | Exceptional 4.9% |
| Ethiopians | 99.8 /100 | #21 | Exceptional 4.9% |
| Immigrants | South Central Asia | 99.8 /100 | #22 | Exceptional 4.9% |
| Hmong | 99.8 /100 | #23 | Exceptional 4.9% |
| Ugandans | 99.7 /100 | #24 | Exceptional 4.9% |
| Immigrants | Singapore | 99.5 /100 | #25 | Exceptional 5.0% |
| Immigrants | Kuwait | 99.5 /100 | #26 | Exceptional 5.0% |
| Danes | 99.5 /100 | #27 | Exceptional 5.0% |