Soviet Union vs Immigrants from Taiwan 11th Grade
COMPARE
Soviet Union
Immigrants from Taiwan
11th Grade
11th Grade Comparison
Soviet Union
Immigrants from Taiwan
93.7%
11TH GRADE
99.5/ 100
METRIC RATING
78th/ 347
METRIC RANK
93.6%
11TH GRADE
99.3/ 100
METRIC RATING
84th/ 347
METRIC RANK
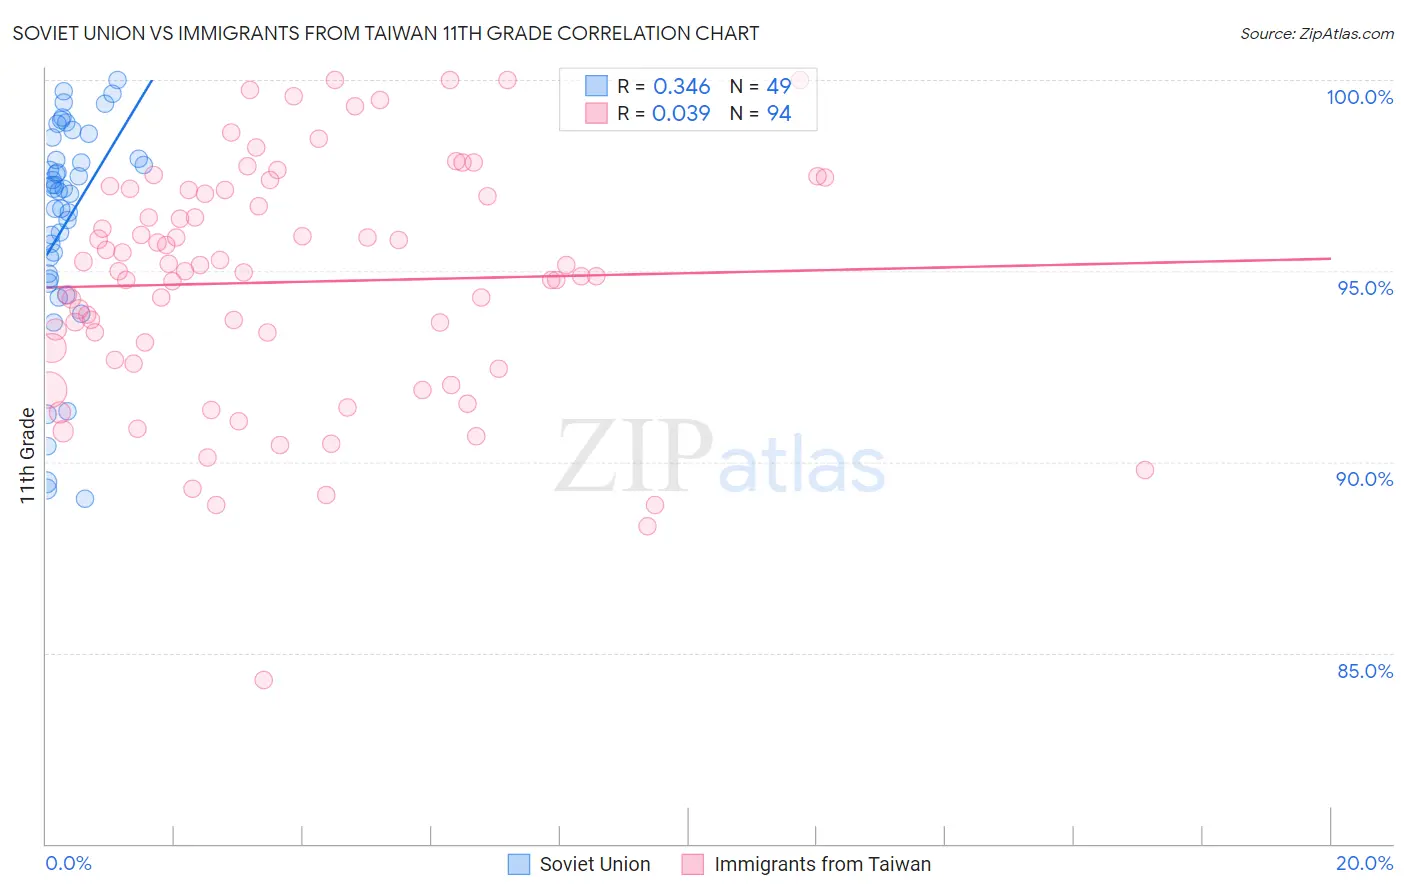
Soviet Union vs Immigrants from Taiwan 11th Grade Correlation Chart
The statistical analysis conducted on geographies consisting of 43,454,395 people shows a mild positive correlation between the proportion of Soviet Union and percentage of population with at least 11th grade education in the United States with a correlation coefficient (R) of 0.346 and weighted average of 93.7%. Similarly, the statistical analysis conducted on geographies consisting of 298,119,887 people shows no correlation between the proportion of Immigrants from Taiwan and percentage of population with at least 11th grade education in the United States with a correlation coefficient (R) of 0.039 and weighted average of 93.6%, a difference of 0.11%.
11th Grade Correlation Summary
| Measurement | Soviet Union | Immigrants from Taiwan |
| Minimum | 89.0% | 84.3% |
| Maximum | 100.0% | 100.0% |
| Range | 11.0% | 15.7% |
| Mean | 96.3% | 94.7% |
| Median | 97.2% | 95.0% |
| Interquartile 25% (IQ1) | 94.9% | 92.7% |
| Interquartile 75% (IQ3) | 98.2% | 97.1% |
| Interquartile Range (IQR) | 3.4% | 4.5% |
| Standard Deviation (Sample) | 2.8% | 3.1% |
| Standard Deviation (Population) | 2.8% | 3.1% |
Demographics Similar to Soviet Union and Immigrants from Taiwan by 11th Grade
In terms of 11th grade, the demographic groups most similar to Soviet Union are Aleut (93.7%, a difference of 0.0%), Celtic (93.7%, a difference of 0.010%), Immigrants from Denmark (93.7%, a difference of 0.010%), Immigrants from Latvia (93.8%, a difference of 0.030%), and Canadian (93.7%, a difference of 0.030%). Similarly, the demographic groups most similar to Immigrants from Taiwan are Icelander (93.6%, a difference of 0.0%), Immigrants from Switzerland (93.6%, a difference of 0.0%), Immigrants from Saudi Arabia (93.7%, a difference of 0.010%), Immigrants from South Central Asia (93.6%, a difference of 0.010%), and Immigrants from Western Europe (93.6%, a difference of 0.020%).
| Demographics | Rating | Rank | 11th Grade |
| Immigrants | South Africa | 99.7 /100 | #71 | Exceptional 93.8% |
| Immigrants | Japan | 99.7 /100 | #72 | Exceptional 93.8% |
| Romanians | 99.6 /100 | #73 | Exceptional 93.8% |
| Immigrants | Czechoslovakia | 99.6 /100 | #74 | Exceptional 93.8% |
| Immigrants | Latvia | 99.6 /100 | #75 | Exceptional 93.8% |
| Celtics | 99.5 /100 | #76 | Exceptional 93.7% |
| Aleuts | 99.5 /100 | #77 | Exceptional 93.7% |
| Soviet Union | 99.5 /100 | #78 | Exceptional 93.7% |
| Immigrants | Denmark | 99.5 /100 | #79 | Exceptional 93.7% |
| Canadians | 99.5 /100 | #80 | Exceptional 93.7% |
| Immigrants | Moldova | 99.5 /100 | #81 | Exceptional 93.7% |
| Immigrants | Saudi Arabia | 99.3 /100 | #82 | Exceptional 93.7% |
| Icelanders | 99.3 /100 | #83 | Exceptional 93.6% |
| Immigrants | Taiwan | 99.3 /100 | #84 | Exceptional 93.6% |
| Immigrants | Switzerland | 99.3 /100 | #85 | Exceptional 93.6% |
| Immigrants | South Central Asia | 99.2 /100 | #86 | Exceptional 93.6% |
| Immigrants | Western Europe | 99.2 /100 | #87 | Exceptional 93.6% |
| Cambodians | 99.2 /100 | #88 | Exceptional 93.6% |
| Burmese | 99.2 /100 | #89 | Exceptional 93.6% |
| Ottawa | 99.2 /100 | #90 | Exceptional 93.6% |
| South Africans | 99.2 /100 | #91 | Exceptional 93.6% |