Soviet Union vs Immigrants from Taiwan Householder Income Ages 25 - 44 years
COMPARE
Soviet Union
Immigrants from Taiwan
Householder Income Ages 25 - 44 years
Householder Income Ages 25 - 44 years Comparison
Soviet Union
Immigrants from Taiwan
$108,457
HOUSEHOLDER INCOME AGES 25 - 44 YEARS
100.0/ 100
METRIC RATING
38th/ 347
METRIC RANK
$129,122
HOUSEHOLDER INCOME AGES 25 - 44 YEARS
100.0/ 100
METRIC RATING
1st/ 347
METRIC RANK
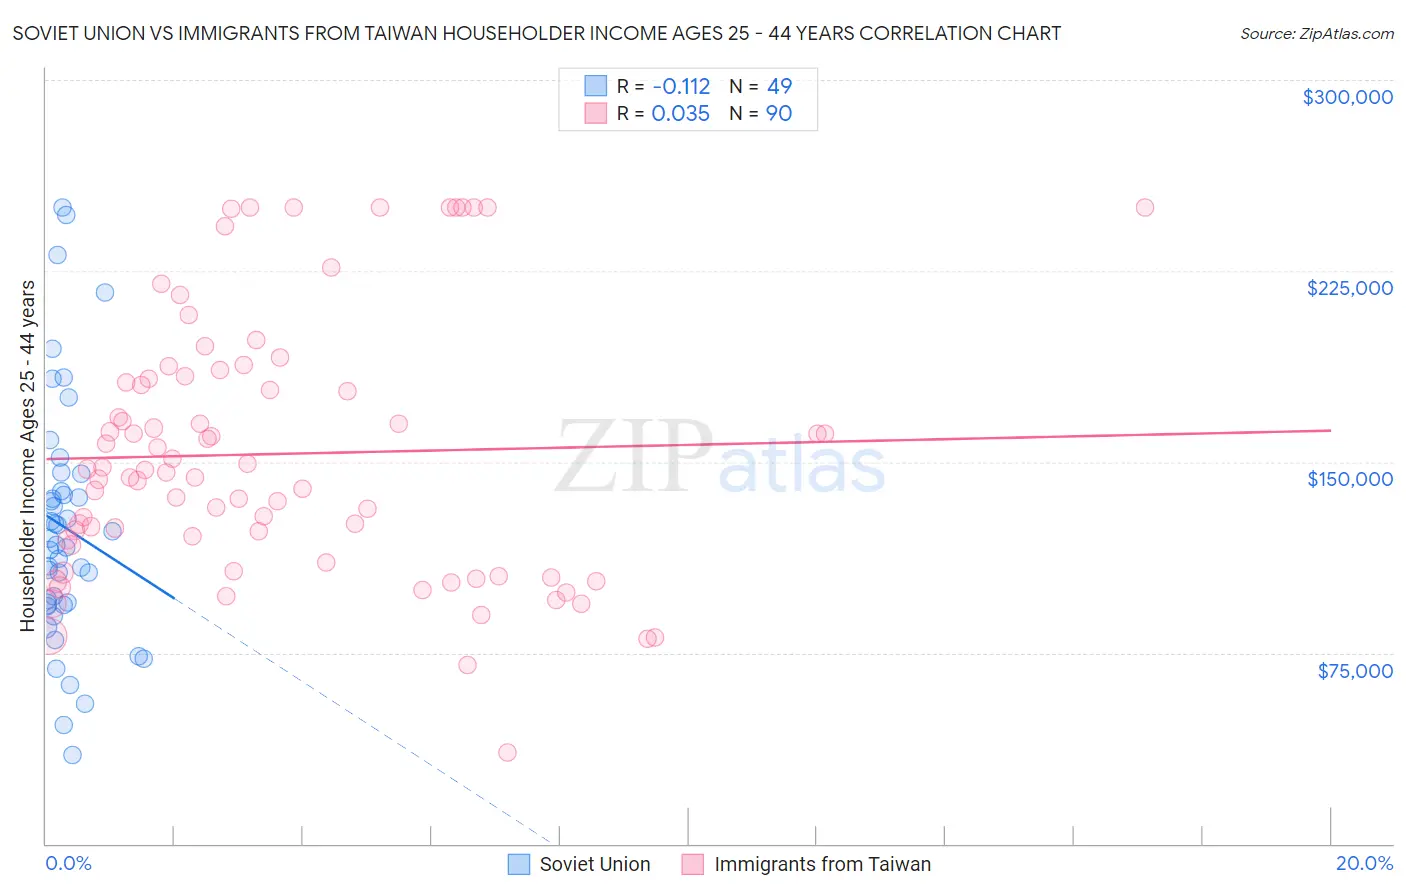
Soviet Union vs Immigrants from Taiwan Householder Income Ages 25 - 44 years Correlation Chart
The statistical analysis conducted on geographies consisting of 43,505,949 people shows a poor negative correlation between the proportion of Soviet Union and household income with householder between the ages 25 and 44 in the United States with a correlation coefficient (R) of -0.112 and weighted average of $108,457. Similarly, the statistical analysis conducted on geographies consisting of 297,780,144 people shows no correlation between the proportion of Immigrants from Taiwan and household income with householder between the ages 25 and 44 in the United States with a correlation coefficient (R) of 0.035 and weighted average of $129,122, a difference of 19.1%.
Householder Income Ages 25 - 44 years Correlation Summary
| Measurement | Soviet Union | Immigrants from Taiwan |
| Minimum | $34,886 | $35,653 |
| Maximum | $250,001 | $250,001 |
| Range | $215,115 | $214,348 |
| Mean | $124,105 | $153,134 |
| Median | $117,252 | $146,407 |
| Interquartile 25% (IQ1) | $94,073 | $117,158 |
| Interquartile 75% (IQ3) | $141,816 | $182,503 |
| Interquartile Range (IQR) | $47,743 | $65,344 |
| Standard Deviation (Sample) | $48,204 | $50,634 |
| Standard Deviation (Population) | $47,710 | $50,352 |
Similar Demographics by Householder Income Ages 25 - 44 years
Demographics Similar to Soviet Union by Householder Income Ages 25 - 44 years
In terms of householder income ages 25 - 44 years, the demographic groups most similar to Soviet Union are Immigrants from France ($108,257, a difference of 0.18%), Immigrants from Russia ($108,751, a difference of 0.27%), Immigrants from Lithuania ($108,149, a difference of 0.29%), Immigrants from Bolivia ($108,128, a difference of 0.30%), and Latvian ($108,926, a difference of 0.43%).
| Demographics | Rating | Rank | Householder Income Ages 25 - 44 years |
| Maltese | 100.0 /100 | #31 | Exceptional $110,064 |
| Immigrants | Sri Lanka | 100.0 /100 | #32 | Exceptional $109,741 |
| Bhutanese | 100.0 /100 | #33 | Exceptional $109,520 |
| Bolivians | 100.0 /100 | #34 | Exceptional $109,372 |
| Immigrants | Switzerland | 100.0 /100 | #35 | Exceptional $109,185 |
| Latvians | 100.0 /100 | #36 | Exceptional $108,926 |
| Immigrants | Russia | 100.0 /100 | #37 | Exceptional $108,751 |
| Soviet Union | 100.0 /100 | #38 | Exceptional $108,457 |
| Immigrants | France | 99.9 /100 | #39 | Exceptional $108,257 |
| Immigrants | Lithuania | 99.9 /100 | #40 | Exceptional $108,149 |
| Immigrants | Bolivia | 99.9 /100 | #41 | Exceptional $108,128 |
| Australians | 99.9 /100 | #42 | Exceptional $107,912 |
| Immigrants | Malaysia | 99.9 /100 | #43 | Exceptional $107,650 |
| Immigrants | Indonesia | 99.9 /100 | #44 | Exceptional $107,627 |
| Israelis | 99.9 /100 | #45 | Exceptional $107,579 |
Demographics Similar to Immigrants from Taiwan by Householder Income Ages 25 - 44 years
In terms of householder income ages 25 - 44 years, the demographic groups most similar to Immigrants from Taiwan are Filipino ($128,723, a difference of 0.31%), Immigrants from Hong Kong ($128,140, a difference of 0.77%), Immigrants from Singapore ($124,429, a difference of 3.8%), Immigrants from India ($124,238, a difference of 3.9%), and Thai ($121,778, a difference of 6.0%).
| Demographics | Rating | Rank | Householder Income Ages 25 - 44 years |
| Immigrants | Taiwan | 100.0 /100 | #1 | Exceptional $129,122 |
| Filipinos | 100.0 /100 | #2 | Exceptional $128,723 |
| Immigrants | Hong Kong | 100.0 /100 | #3 | Exceptional $128,140 |
| Immigrants | Singapore | 100.0 /100 | #4 | Exceptional $124,429 |
| Immigrants | India | 100.0 /100 | #5 | Exceptional $124,238 |
| Thais | 100.0 /100 | #6 | Exceptional $121,778 |
| Immigrants | Ireland | 100.0 /100 | #7 | Exceptional $120,333 |
| Iranians | 100.0 /100 | #8 | Exceptional $120,292 |
| Immigrants | China | 100.0 /100 | #9 | Exceptional $119,756 |
| Indians (Asian) | 100.0 /100 | #10 | Exceptional $119,496 |
| Okinawans | 100.0 /100 | #11 | Exceptional $119,349 |
| Immigrants | Iran | 100.0 /100 | #12 | Exceptional $119,204 |
| Immigrants | Eastern Asia | 100.0 /100 | #13 | Exceptional $118,056 |
| Immigrants | Israel | 100.0 /100 | #14 | Exceptional $117,219 |
| Immigrants | South Central Asia | 100.0 /100 | #15 | Exceptional $116,626 |