Somali vs Immigrants from Kenya In Labor Force | Age 25-29
COMPARE
Somali
Immigrants from Kenya
In Labor Force | Age 25-29
In Labor Force | Age 25-29 Comparison
Somalis
Immigrants from Kenya
87.1%
IN LABOR FORCE | AGE 25-29
100.0/ 100
METRIC RATING
3rd/ 347
METRIC RANK
85.4%
IN LABOR FORCE | AGE 25-29
99.4/ 100
METRIC RATING
63rd/ 347
METRIC RANK
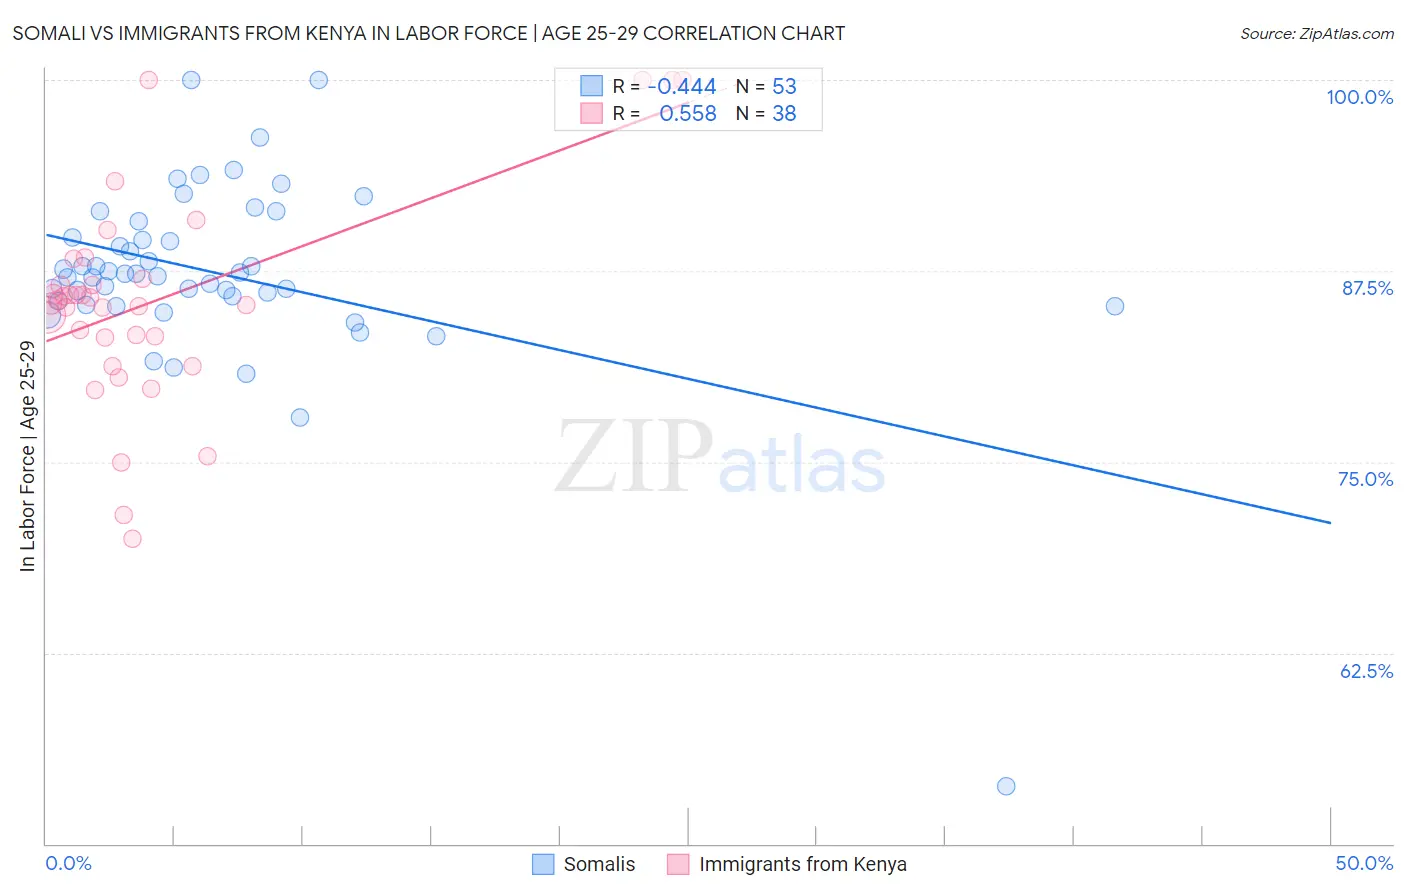
Somali vs Immigrants from Kenya In Labor Force | Age 25-29 Correlation Chart
The statistical analysis conducted on geographies consisting of 99,327,159 people shows a moderate negative correlation between the proportion of Somalis and labor force participation rate among population between the ages 25 and 29 in the United States with a correlation coefficient (R) of -0.444 and weighted average of 87.1%. Similarly, the statistical analysis conducted on geographies consisting of 218,069,708 people shows a substantial positive correlation between the proportion of Immigrants from Kenya and labor force participation rate among population between the ages 25 and 29 in the United States with a correlation coefficient (R) of 0.558 and weighted average of 85.4%, a difference of 1.9%.
In Labor Force | Age 25-29 Correlation Summary
| Measurement | Somali | Immigrants from Kenya |
| Minimum | 53.8% | 70.0% |
| Maximum | 100.0% | 100.0% |
| Range | 46.2% | 30.0% |
| Mean | 87.4% | 85.5% |
| Median | 87.3% | 85.5% |
| Interquartile 25% (IQ1) | 85.4% | 83.1% |
| Interquartile 75% (IQ3) | 90.2% | 87.0% |
| Interquartile Range (IQR) | 4.8% | 3.9% |
| Standard Deviation (Sample) | 6.4% | 6.9% |
| Standard Deviation (Population) | 6.3% | 6.8% |
Similar Demographics by In Labor Force | Age 25-29
Demographics Similar to Somalis by In Labor Force | Age 25-29
In terms of in labor force | age 25-29, the demographic groups most similar to Somalis are Immigrants from Somalia (87.1%, a difference of 0.010%), Carpatho Rusyn (87.0%, a difference of 0.090%), Luxembourger (86.9%, a difference of 0.19%), Slovene (86.4%, a difference of 0.80%), and Immigrants from Bosnia and Herzegovina (86.3%, a difference of 0.93%).
| Demographics | Rating | Rank | In Labor Force | Age 25-29 |
| Tsimshian | 100.0 /100 | #1 | Exceptional 88.7% |
| Immigrants | Somalia | 100.0 /100 | #2 | Exceptional 87.1% |
| Somalis | 100.0 /100 | #3 | Exceptional 87.1% |
| Carpatho Rusyns | 100.0 /100 | #4 | Exceptional 87.0% |
| Luxembourgers | 100.0 /100 | #5 | Exceptional 86.9% |
| Slovenes | 100.0 /100 | #6 | Exceptional 86.4% |
| Immigrants | Bosnia and Herzegovina | 100.0 /100 | #7 | Exceptional 86.3% |
| Immigrants | Cabo Verde | 100.0 /100 | #8 | Exceptional 86.2% |
| Ethiopians | 100.0 /100 | #9 | Exceptional 86.2% |
| Liberians | 100.0 /100 | #10 | Exceptional 86.1% |
| Immigrants | Ethiopia | 100.0 /100 | #11 | Exceptional 86.1% |
| Immigrants | Lithuania | 100.0 /100 | #12 | Exceptional 86.1% |
| Norwegians | 100.0 /100 | #13 | Exceptional 86.1% |
| Latvians | 100.0 /100 | #14 | Exceptional 86.1% |
| Bolivians | 100.0 /100 | #15 | Exceptional 86.1% |
Demographics Similar to Immigrants from Kenya by In Labor Force | Age 25-29
In terms of in labor force | age 25-29, the demographic groups most similar to Immigrants from Kenya are Taiwanese (85.4%, a difference of 0.010%), Thai (85.5%, a difference of 0.020%), Serbian (85.5%, a difference of 0.020%), Immigrants from Italy (85.4%, a difference of 0.020%), and Immigrants from Czechoslovakia (85.4%, a difference of 0.030%).
| Demographics | Rating | Rank | In Labor Force | Age 25-29 |
| Eastern Europeans | 99.6 /100 | #56 | Exceptional 85.5% |
| Estonians | 99.6 /100 | #57 | Exceptional 85.5% |
| Greeks | 99.6 /100 | #58 | Exceptional 85.5% |
| Immigrants | Morocco | 99.5 /100 | #59 | Exceptional 85.5% |
| Thais | 99.5 /100 | #60 | Exceptional 85.5% |
| Serbians | 99.5 /100 | #61 | Exceptional 85.5% |
| Taiwanese | 99.4 /100 | #62 | Exceptional 85.4% |
| Immigrants | Kenya | 99.4 /100 | #63 | Exceptional 85.4% |
| Immigrants | Italy | 99.3 /100 | #64 | Exceptional 85.4% |
| Immigrants | Czechoslovakia | 99.3 /100 | #65 | Exceptional 85.4% |
| Immigrants | Scotland | 99.3 /100 | #66 | Exceptional 85.4% |
| Immigrants | Turkey | 99.2 /100 | #67 | Exceptional 85.4% |
| Immigrants | Cameroon | 99.2 /100 | #68 | Exceptional 85.4% |
| Menominee | 99.1 /100 | #69 | Exceptional 85.4% |
| Immigrants | Sweden | 99.1 /100 | #70 | Exceptional 85.4% |