Somali vs Puerto Rican In Labor Force | Age 25-29
COMPARE
Somali
Puerto Rican
In Labor Force | Age 25-29
In Labor Force | Age 25-29 Comparison
Somalis
Puerto Ricans
87.1%
IN LABOR FORCE | AGE 25-29
100.0/ 100
METRIC RATING
3rd/ 347
METRIC RANK
80.4%
IN LABOR FORCE | AGE 25-29
0.0/ 100
METRIC RATING
330th/ 347
METRIC RANK
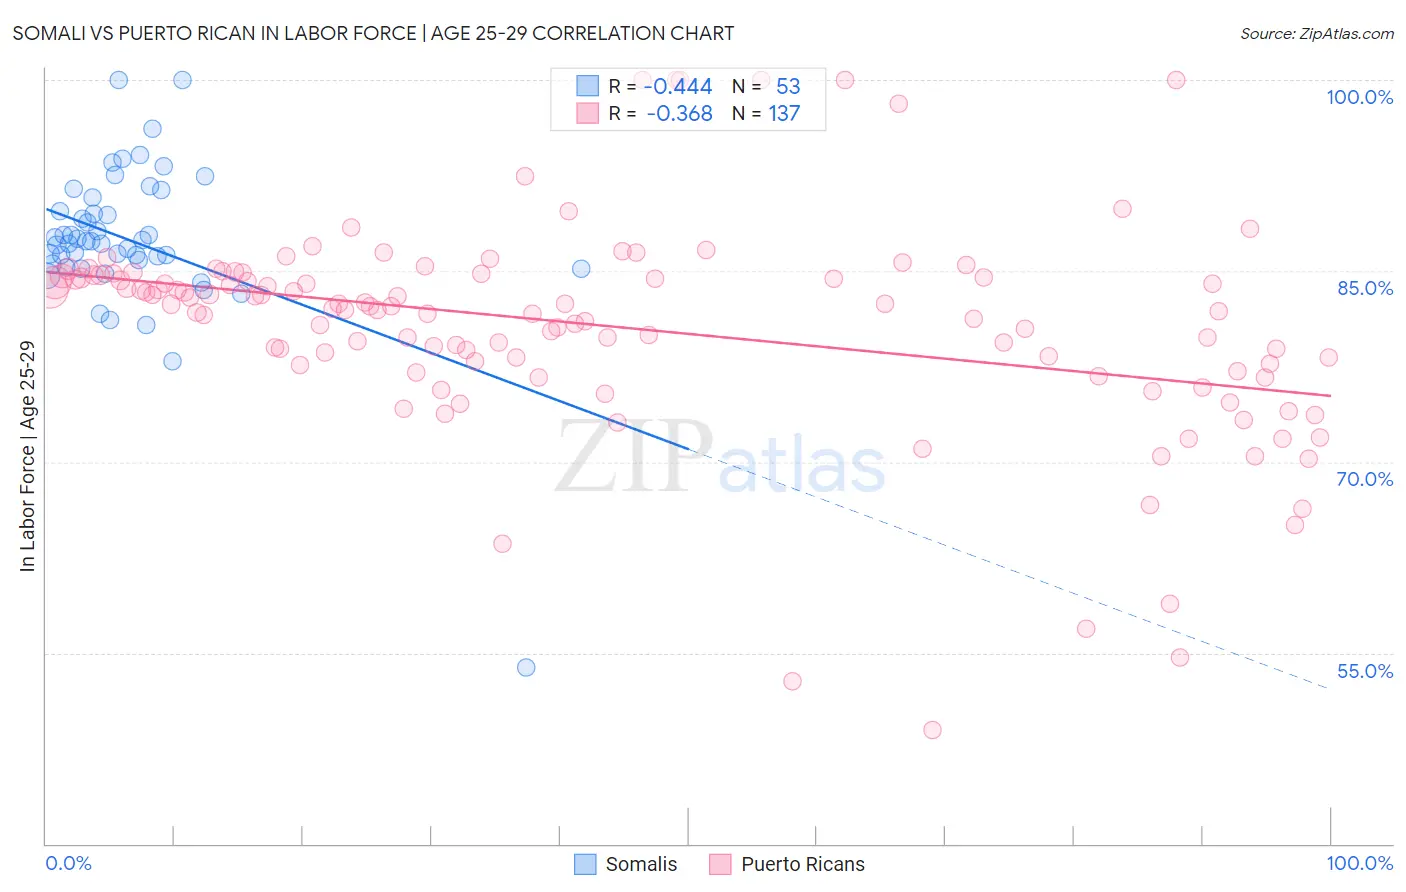
Somali vs Puerto Rican In Labor Force | Age 25-29 Correlation Chart
The statistical analysis conducted on geographies consisting of 99,327,159 people shows a moderate negative correlation between the proportion of Somalis and labor force participation rate among population between the ages 25 and 29 in the United States with a correlation coefficient (R) of -0.444 and weighted average of 87.1%. Similarly, the statistical analysis conducted on geographies consisting of 527,795,348 people shows a mild negative correlation between the proportion of Puerto Ricans and labor force participation rate among population between the ages 25 and 29 in the United States with a correlation coefficient (R) of -0.368 and weighted average of 80.4%, a difference of 8.3%.
In Labor Force | Age 25-29 Correlation Summary
| Measurement | Somali | Puerto Rican |
| Minimum | 53.8% | 48.9% |
| Maximum | 100.0% | 100.0% |
| Range | 46.2% | 51.1% |
| Mean | 87.4% | 80.7% |
| Median | 87.3% | 82.2% |
| Interquartile 25% (IQ1) | 85.4% | 77.7% |
| Interquartile 75% (IQ3) | 90.2% | 84.6% |
| Interquartile Range (IQR) | 4.8% | 6.9% |
| Standard Deviation (Sample) | 6.4% | 8.4% |
| Standard Deviation (Population) | 6.3% | 8.3% |
Similar Demographics by In Labor Force | Age 25-29
Demographics Similar to Somalis by In Labor Force | Age 25-29
In terms of in labor force | age 25-29, the demographic groups most similar to Somalis are Immigrants from Somalia (87.1%, a difference of 0.010%), Carpatho Rusyn (87.0%, a difference of 0.090%), Luxembourger (86.9%, a difference of 0.19%), Slovene (86.4%, a difference of 0.80%), and Immigrants from Bosnia and Herzegovina (86.3%, a difference of 0.93%).
| Demographics | Rating | Rank | In Labor Force | Age 25-29 |
| Tsimshian | 100.0 /100 | #1 | Exceptional 88.7% |
| Immigrants | Somalia | 100.0 /100 | #2 | Exceptional 87.1% |
| Somalis | 100.0 /100 | #3 | Exceptional 87.1% |
| Carpatho Rusyns | 100.0 /100 | #4 | Exceptional 87.0% |
| Luxembourgers | 100.0 /100 | #5 | Exceptional 86.9% |
| Slovenes | 100.0 /100 | #6 | Exceptional 86.4% |
| Immigrants | Bosnia and Herzegovina | 100.0 /100 | #7 | Exceptional 86.3% |
| Immigrants | Cabo Verde | 100.0 /100 | #8 | Exceptional 86.2% |
| Ethiopians | 100.0 /100 | #9 | Exceptional 86.2% |
| Liberians | 100.0 /100 | #10 | Exceptional 86.1% |
| Immigrants | Ethiopia | 100.0 /100 | #11 | Exceptional 86.1% |
| Immigrants | Lithuania | 100.0 /100 | #12 | Exceptional 86.1% |
| Norwegians | 100.0 /100 | #13 | Exceptional 86.1% |
| Latvians | 100.0 /100 | #14 | Exceptional 86.1% |
| Bolivians | 100.0 /100 | #15 | Exceptional 86.1% |
Demographics Similar to Puerto Ricans by In Labor Force | Age 25-29
In terms of in labor force | age 25-29, the demographic groups most similar to Puerto Ricans are Cheyenne (80.3%, a difference of 0.14%), Yakama (80.6%, a difference of 0.23%), Creek (80.7%, a difference of 0.34%), Ute (80.8%, a difference of 0.48%), and Choctaw (81.0%, a difference of 0.69%).
| Demographics | Rating | Rank | In Labor Force | Age 25-29 |
| Alaska Natives | 0.0 /100 | #323 | Tragic 81.6% |
| Houma | 0.0 /100 | #324 | Tragic 81.2% |
| Dutch West Indians | 0.0 /100 | #325 | Tragic 81.1% |
| Choctaw | 0.0 /100 | #326 | Tragic 81.0% |
| Ute | 0.0 /100 | #327 | Tragic 80.8% |
| Creek | 0.0 /100 | #328 | Tragic 80.7% |
| Yakama | 0.0 /100 | #329 | Tragic 80.6% |
| Puerto Ricans | 0.0 /100 | #330 | Tragic 80.4% |
| Cheyenne | 0.0 /100 | #331 | Tragic 80.3% |
| Inupiat | 0.0 /100 | #332 | Tragic 79.8% |
| Sioux | 0.0 /100 | #333 | Tragic 79.7% |
| Yuman | 0.0 /100 | #334 | Tragic 79.3% |
| Natives/Alaskans | 0.0 /100 | #335 | Tragic 79.3% |
| Apache | 0.0 /100 | #336 | Tragic 79.2% |
| Crow | 0.0 /100 | #337 | Tragic 78.6% |