Somali vs Immigrants from Kenya Male Disability
COMPARE
Somali
Immigrants from Kenya
Male Disability
Male Disability Comparison
Somalis
Immigrants from Kenya
11.4%
MALE DISABILITY
18.2/ 100
METRIC RATING
197th/ 347
METRIC RANK
11.1%
MALE DISABILITY
63.8/ 100
METRIC RATING
163rd/ 347
METRIC RANK
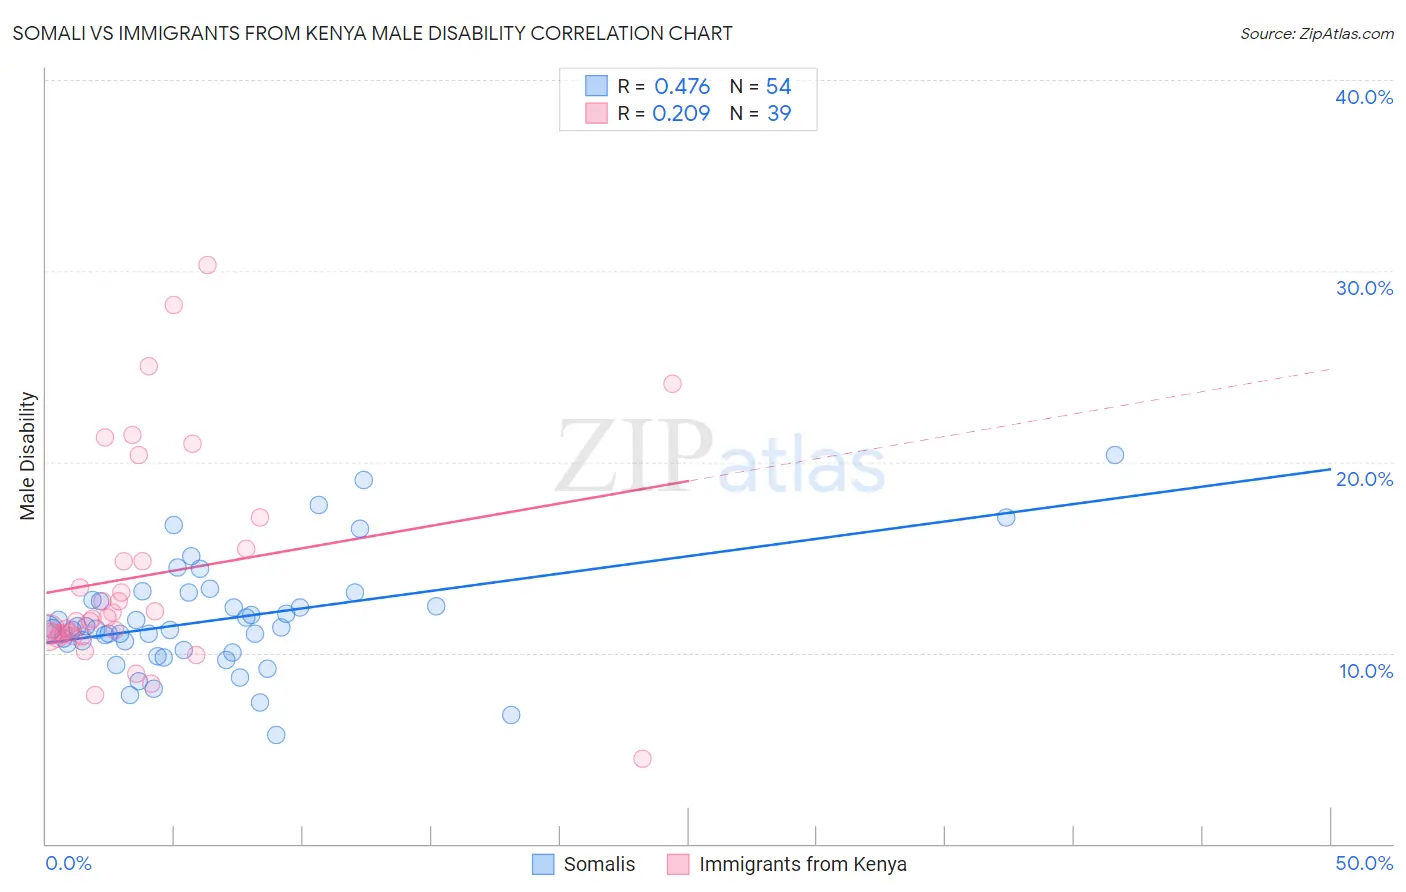
Somali vs Immigrants from Kenya Male Disability Correlation Chart
The statistical analysis conducted on geographies consisting of 99,314,989 people shows a moderate positive correlation between the proportion of Somalis and percentage of males with a disability in the United States with a correlation coefficient (R) of 0.476 and weighted average of 11.4%. Similarly, the statistical analysis conducted on geographies consisting of 218,057,071 people shows a weak positive correlation between the proportion of Immigrants from Kenya and percentage of males with a disability in the United States with a correlation coefficient (R) of 0.209 and weighted average of 11.1%, a difference of 2.9%.
Male Disability Correlation Summary
| Measurement | Somali | Immigrants from Kenya |
| Minimum | 5.7% | 4.4% |
| Maximum | 20.4% | 30.3% |
| Range | 14.6% | 25.8% |
| Mean | 11.8% | 14.0% |
| Median | 11.2% | 11.8% |
| Interquartile 25% (IQ1) | 10.1% | 11.0% |
| Interquartile 75% (IQ3) | 12.7% | 15.4% |
| Interquartile Range (IQR) | 2.6% | 4.4% |
| Standard Deviation (Sample) | 2.9% | 5.7% |
| Standard Deviation (Population) | 2.9% | 5.7% |
Similar Demographics by Male Disability
Demographics Similar to Somalis by Male Disability
In terms of male disability, the demographic groups most similar to Somalis are West Indian (11.4%, a difference of 0.020%), Immigrants from Jamaica (11.5%, a difference of 0.18%), Immigrants from Oceania (11.4%, a difference of 0.23%), Belizean (11.4%, a difference of 0.26%), and Lebanese (11.5%, a difference of 0.27%).
| Demographics | Rating | Rank | Male Disability |
| Immigrants | Bosnia and Herzegovina | 25.4 /100 | #190 | Fair 11.4% |
| Senegalese | 23.2 /100 | #191 | Fair 11.4% |
| Assyrians/Chaldeans/Syriacs | 23.2 /100 | #192 | Fair 11.4% |
| Greeks | 22.2 /100 | #193 | Fair 11.4% |
| Belizeans | 21.2 /100 | #194 | Fair 11.4% |
| Immigrants | Oceania | 20.9 /100 | #195 | Fair 11.4% |
| West Indians | 18.4 /100 | #196 | Poor 11.4% |
| Somalis | 18.2 /100 | #197 | Poor 11.4% |
| Immigrants | Jamaica | 16.3 /100 | #198 | Poor 11.5% |
| Lebanese | 15.4 /100 | #199 | Poor 11.5% |
| Immigrants | Iraq | 13.0 /100 | #200 | Poor 11.5% |
| Immigrants | Panama | 13.0 /100 | #201 | Poor 11.5% |
| Immigrants | Mexico | 12.6 /100 | #202 | Poor 11.5% |
| Jamaicans | 10.9 /100 | #203 | Poor 11.5% |
| Immigrants | Cambodia | 10.8 /100 | #204 | Poor 11.5% |
Demographics Similar to Immigrants from Kenya by Male Disability
In terms of male disability, the demographic groups most similar to Immigrants from Kenya are British West Indian (11.1%, a difference of 0.060%), Immigrants from Haiti (11.1%, a difference of 0.090%), Luxembourger (11.1%, a difference of 0.11%), Immigrants from West Indies (11.1%, a difference of 0.12%), and Immigrants from Hungary (11.1%, a difference of 0.15%).
| Demographics | Rating | Rank | Male Disability |
| Russians | 69.8 /100 | #156 | Good 11.1% |
| Immigrants | Western Africa | 69.2 /100 | #157 | Good 11.1% |
| Latvians | 68.1 /100 | #158 | Good 11.1% |
| Guatemalans | 67.2 /100 | #159 | Good 11.1% |
| Albanians | 66.5 /100 | #160 | Good 11.1% |
| Immigrants | West Indies | 65.7 /100 | #161 | Good 11.1% |
| Immigrants | Haiti | 65.3 /100 | #162 | Good 11.1% |
| Immigrants | Kenya | 63.8 /100 | #163 | Good 11.1% |
| British West Indians | 62.8 /100 | #164 | Good 11.1% |
| Luxembourgers | 61.9 /100 | #165 | Good 11.1% |
| Immigrants | Hungary | 61.2 /100 | #166 | Good 11.1% |
| Immigrants | Southern Europe | 54.4 /100 | #167 | Average 11.2% |
| Immigrants | Latin America | 54.0 /100 | #168 | Average 11.2% |
| Barbadians | 53.4 /100 | #169 | Average 11.2% |
| New Zealanders | 52.9 /100 | #170 | Average 11.2% |