Samoan vs Immigrants from Kenya In Labor Force | Age 25-29
COMPARE
Samoan
Immigrants from Kenya
In Labor Force | Age 25-29
In Labor Force | Age 25-29 Comparison
Samoans
Immigrants from Kenya
83.3%
IN LABOR FORCE | AGE 25-29
0.0/ 100
METRIC RATING
275th/ 347
METRIC RANK
85.4%
IN LABOR FORCE | AGE 25-29
99.4/ 100
METRIC RATING
63rd/ 347
METRIC RANK
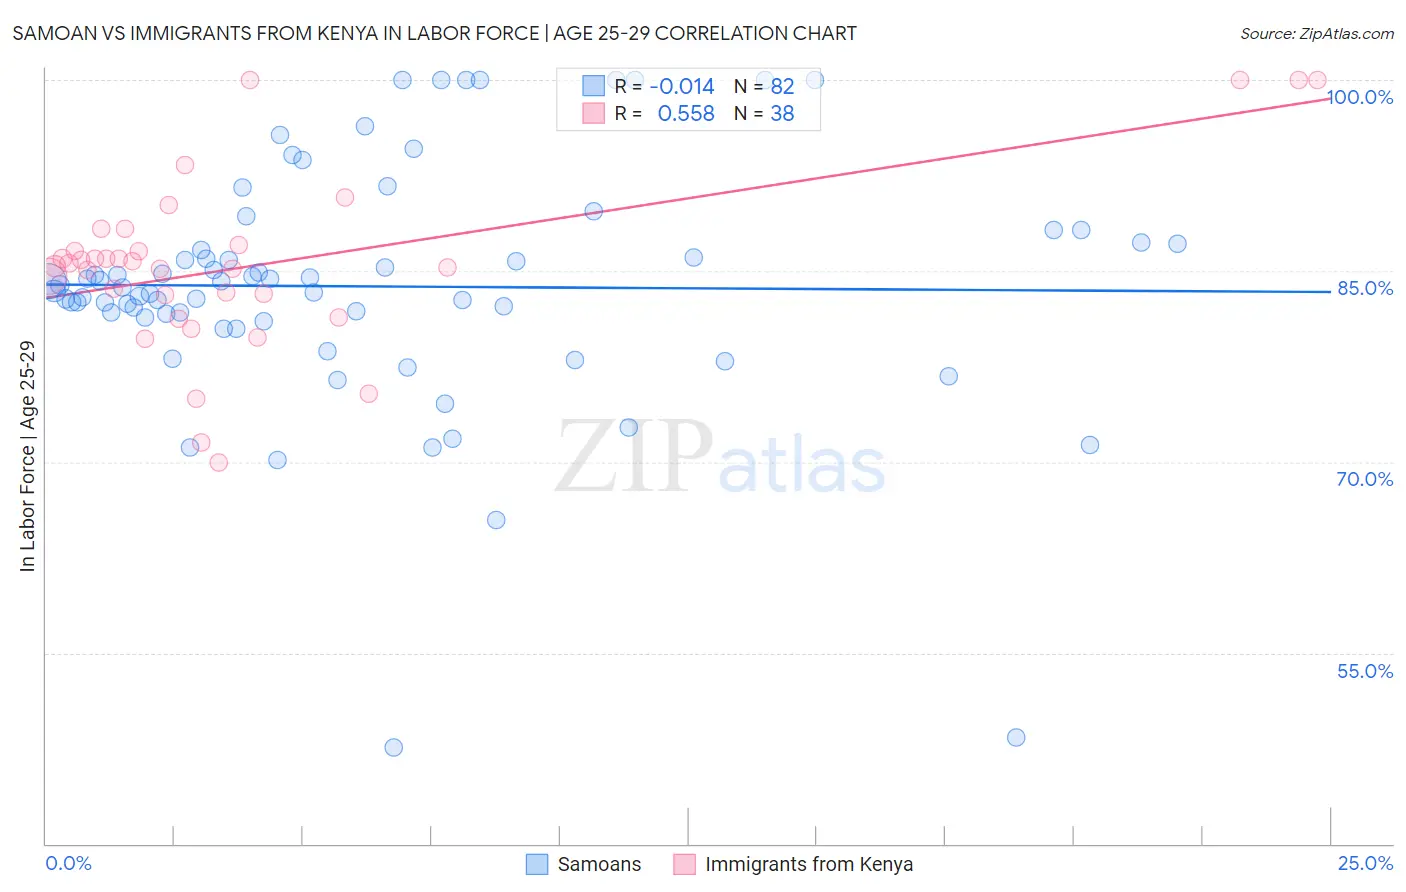
Samoan vs Immigrants from Kenya In Labor Force | Age 25-29 Correlation Chart
The statistical analysis conducted on geographies consisting of 225,148,243 people shows no correlation between the proportion of Samoans and labor force participation rate among population between the ages 25 and 29 in the United States with a correlation coefficient (R) of -0.014 and weighted average of 83.3%. Similarly, the statistical analysis conducted on geographies consisting of 218,069,708 people shows a substantial positive correlation between the proportion of Immigrants from Kenya and labor force participation rate among population between the ages 25 and 29 in the United States with a correlation coefficient (R) of 0.558 and weighted average of 85.4%, a difference of 2.6%.
In Labor Force | Age 25-29 Correlation Summary
| Measurement | Samoan | Immigrants from Kenya |
| Minimum | 47.6% | 70.0% |
| Maximum | 100.0% | 100.0% |
| Range | 52.4% | 30.0% |
| Mean | 83.8% | 85.5% |
| Median | 83.8% | 85.5% |
| Interquartile 25% (IQ1) | 81.3% | 83.1% |
| Interquartile 75% (IQ3) | 87.1% | 87.0% |
| Interquartile Range (IQR) | 5.8% | 3.9% |
| Standard Deviation (Sample) | 9.5% | 6.9% |
| Standard Deviation (Population) | 9.4% | 6.8% |
Similar Demographics by In Labor Force | Age 25-29
Demographics Similar to Samoans by In Labor Force | Age 25-29
In terms of in labor force | age 25-29, the demographic groups most similar to Samoans are Immigrants from Honduras (83.3%, a difference of 0.0%), Marshallese (83.3%, a difference of 0.050%), Immigrants from Caribbean (83.4%, a difference of 0.070%), Immigrants from Dominica (83.4%, a difference of 0.070%), and African (83.2%, a difference of 0.070%).
| Demographics | Rating | Rank | In Labor Force | Age 25-29 |
| Immigrants | Lebanon | 0.0 /100 | #268 | Tragic 83.4% |
| Immigrants | Barbados | 0.0 /100 | #269 | Tragic 83.4% |
| Basques | 0.0 /100 | #270 | Tragic 83.4% |
| Hondurans | 0.0 /100 | #271 | Tragic 83.4% |
| Immigrants | Caribbean | 0.0 /100 | #272 | Tragic 83.4% |
| Immigrants | Dominica | 0.0 /100 | #273 | Tragic 83.4% |
| Marshallese | 0.0 /100 | #274 | Tragic 83.3% |
| Samoans | 0.0 /100 | #275 | Tragic 83.3% |
| Immigrants | Honduras | 0.0 /100 | #276 | Tragic 83.3% |
| Africans | 0.0 /100 | #277 | Tragic 83.2% |
| Immigrants | Cuba | 0.0 /100 | #278 | Tragic 83.2% |
| British West Indians | 0.0 /100 | #279 | Tragic 83.2% |
| Dominicans | 0.0 /100 | #280 | Tragic 83.2% |
| Immigrants | Dominican Republic | 0.0 /100 | #281 | Tragic 83.1% |
| Americans | 0.0 /100 | #282 | Tragic 83.1% |
Demographics Similar to Immigrants from Kenya by In Labor Force | Age 25-29
In terms of in labor force | age 25-29, the demographic groups most similar to Immigrants from Kenya are Taiwanese (85.4%, a difference of 0.010%), Thai (85.5%, a difference of 0.020%), Serbian (85.5%, a difference of 0.020%), Immigrants from Italy (85.4%, a difference of 0.020%), and Immigrants from Czechoslovakia (85.4%, a difference of 0.030%).
| Demographics | Rating | Rank | In Labor Force | Age 25-29 |
| Eastern Europeans | 99.6 /100 | #56 | Exceptional 85.5% |
| Estonians | 99.6 /100 | #57 | Exceptional 85.5% |
| Greeks | 99.6 /100 | #58 | Exceptional 85.5% |
| Immigrants | Morocco | 99.5 /100 | #59 | Exceptional 85.5% |
| Thais | 99.5 /100 | #60 | Exceptional 85.5% |
| Serbians | 99.5 /100 | #61 | Exceptional 85.5% |
| Taiwanese | 99.4 /100 | #62 | Exceptional 85.4% |
| Immigrants | Kenya | 99.4 /100 | #63 | Exceptional 85.4% |
| Immigrants | Italy | 99.3 /100 | #64 | Exceptional 85.4% |
| Immigrants | Czechoslovakia | 99.3 /100 | #65 | Exceptional 85.4% |
| Immigrants | Scotland | 99.3 /100 | #66 | Exceptional 85.4% |
| Immigrants | Turkey | 99.2 /100 | #67 | Exceptional 85.4% |
| Immigrants | Cameroon | 99.2 /100 | #68 | Exceptional 85.4% |
| Menominee | 99.1 /100 | #69 | Exceptional 85.4% |
| Immigrants | Sweden | 99.1 /100 | #70 | Exceptional 85.4% |