Kiowa vs Immigrants from Kenya In Labor Force | Age 25-29
COMPARE
Kiowa
Immigrants from Kenya
In Labor Force | Age 25-29
In Labor Force | Age 25-29 Comparison
Kiowa
Immigrants from Kenya
81.6%
IN LABOR FORCE | AGE 25-29
0.0/ 100
METRIC RATING
322nd/ 347
METRIC RANK
85.4%
IN LABOR FORCE | AGE 25-29
99.4/ 100
METRIC RATING
63rd/ 347
METRIC RANK
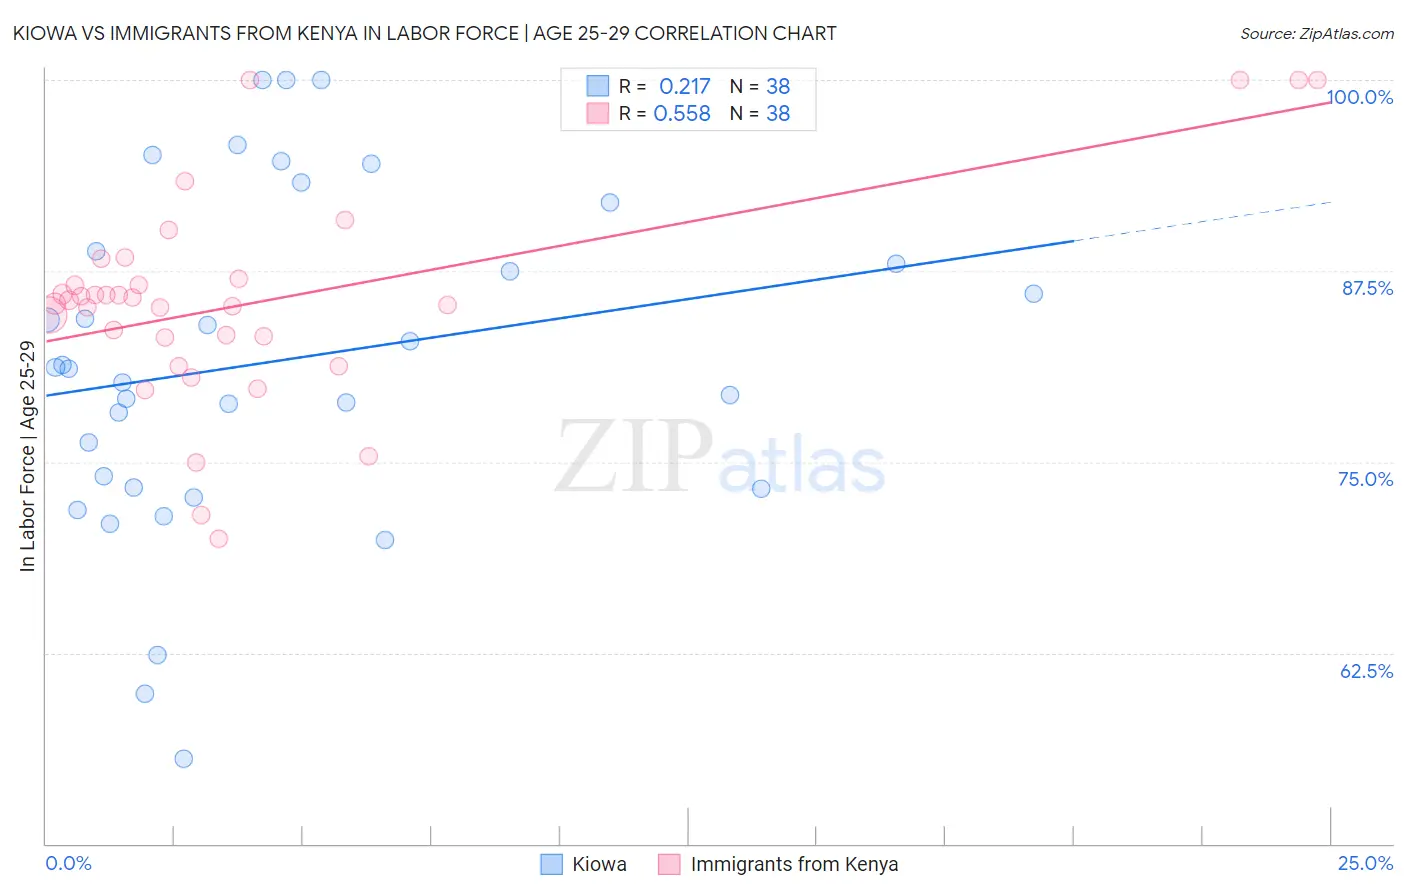
Kiowa vs Immigrants from Kenya In Labor Force | Age 25-29 Correlation Chart
The statistical analysis conducted on geographies consisting of 56,097,526 people shows a weak positive correlation between the proportion of Kiowa and labor force participation rate among population between the ages 25 and 29 in the United States with a correlation coefficient (R) of 0.217 and weighted average of 81.6%. Similarly, the statistical analysis conducted on geographies consisting of 218,069,708 people shows a substantial positive correlation between the proportion of Immigrants from Kenya and labor force participation rate among population between the ages 25 and 29 in the United States with a correlation coefficient (R) of 0.558 and weighted average of 85.4%, a difference of 4.7%.
In Labor Force | Age 25-29 Correlation Summary
| Measurement | Kiowa | Immigrants from Kenya |
| Minimum | 55.6% | 70.0% |
| Maximum | 100.0% | 100.0% |
| Range | 44.4% | 30.0% |
| Mean | 81.6% | 85.5% |
| Median | 81.1% | 85.5% |
| Interquartile 25% (IQ1) | 73.3% | 83.1% |
| Interquartile 75% (IQ3) | 88.8% | 87.0% |
| Interquartile Range (IQR) | 15.5% | 3.9% |
| Standard Deviation (Sample) | 11.0% | 6.9% |
| Standard Deviation (Population) | 10.8% | 6.8% |
Similar Demographics by In Labor Force | Age 25-29
Demographics Similar to Kiowa by In Labor Force | Age 25-29
In terms of in labor force | age 25-29, the demographic groups most similar to Kiowa are Shoshone (81.6%, a difference of 0.010%), Alaska Native (81.6%, a difference of 0.050%), Colville (81.6%, a difference of 0.070%), Seminole (81.7%, a difference of 0.12%), and Comanche (81.9%, a difference of 0.33%).
| Demographics | Rating | Rank | In Labor Force | Age 25-29 |
| Immigrants | Mexico | 0.0 /100 | #315 | Tragic 82.0% |
| Mexicans | 0.0 /100 | #316 | Tragic 81.9% |
| Chickasaw | 0.0 /100 | #317 | Tragic 81.9% |
| Comanche | 0.0 /100 | #318 | Tragic 81.9% |
| Seminole | 0.0 /100 | #319 | Tragic 81.7% |
| Colville | 0.0 /100 | #320 | Tragic 81.6% |
| Shoshone | 0.0 /100 | #321 | Tragic 81.6% |
| Kiowa | 0.0 /100 | #322 | Tragic 81.6% |
| Alaska Natives | 0.0 /100 | #323 | Tragic 81.6% |
| Houma | 0.0 /100 | #324 | Tragic 81.2% |
| Dutch West Indians | 0.0 /100 | #325 | Tragic 81.1% |
| Choctaw | 0.0 /100 | #326 | Tragic 81.0% |
| Ute | 0.0 /100 | #327 | Tragic 80.8% |
| Creek | 0.0 /100 | #328 | Tragic 80.7% |
| Yakama | 0.0 /100 | #329 | Tragic 80.6% |
Demographics Similar to Immigrants from Kenya by In Labor Force | Age 25-29
In terms of in labor force | age 25-29, the demographic groups most similar to Immigrants from Kenya are Taiwanese (85.4%, a difference of 0.010%), Thai (85.5%, a difference of 0.020%), Serbian (85.5%, a difference of 0.020%), Immigrants from Italy (85.4%, a difference of 0.020%), and Immigrants from Czechoslovakia (85.4%, a difference of 0.030%).
| Demographics | Rating | Rank | In Labor Force | Age 25-29 |
| Eastern Europeans | 99.6 /100 | #56 | Exceptional 85.5% |
| Estonians | 99.6 /100 | #57 | Exceptional 85.5% |
| Greeks | 99.6 /100 | #58 | Exceptional 85.5% |
| Immigrants | Morocco | 99.5 /100 | #59 | Exceptional 85.5% |
| Thais | 99.5 /100 | #60 | Exceptional 85.5% |
| Serbians | 99.5 /100 | #61 | Exceptional 85.5% |
| Taiwanese | 99.4 /100 | #62 | Exceptional 85.4% |
| Immigrants | Kenya | 99.4 /100 | #63 | Exceptional 85.4% |
| Immigrants | Italy | 99.3 /100 | #64 | Exceptional 85.4% |
| Immigrants | Czechoslovakia | 99.3 /100 | #65 | Exceptional 85.4% |
| Immigrants | Scotland | 99.3 /100 | #66 | Exceptional 85.4% |
| Immigrants | Turkey | 99.2 /100 | #67 | Exceptional 85.4% |
| Immigrants | Cameroon | 99.2 /100 | #68 | Exceptional 85.4% |
| Menominee | 99.1 /100 | #69 | Exceptional 85.4% |
| Immigrants | Sweden | 99.1 /100 | #70 | Exceptional 85.4% |