Slavic vs Albanian In Labor Force | Age > 16
COMPARE
Slavic
Albanian
In Labor Force | Age > 16
In Labor Force | Age > 16 Comparison
Slavs
Albanians
64.6%
IN LABOR FORCE | AGE > 16
4.9/ 100
METRIC RATING
233rd/ 347
METRIC RANK
65.3%
IN LABOR FORCE | AGE > 16
70.8/ 100
METRIC RATING
162nd/ 347
METRIC RANK
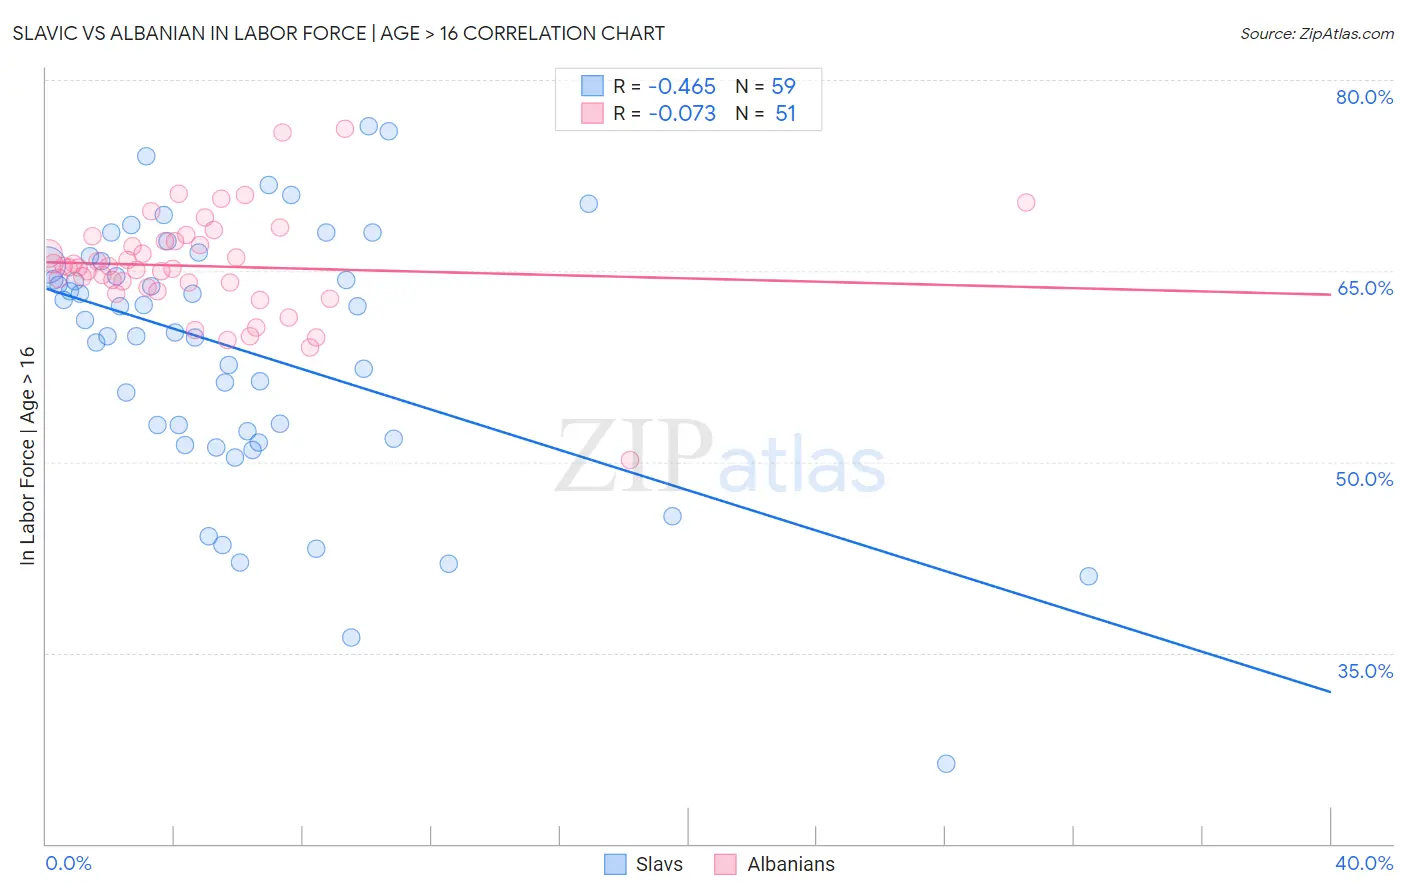
Slavic vs Albanian In Labor Force | Age > 16 Correlation Chart
The statistical analysis conducted on geographies consisting of 270,879,770 people shows a moderate negative correlation between the proportion of Slavs and labor force participation rate among population ages 16 and over in the United States with a correlation coefficient (R) of -0.465 and weighted average of 64.6%. Similarly, the statistical analysis conducted on geographies consisting of 193,265,279 people shows a slight negative correlation between the proportion of Albanians and labor force participation rate among population ages 16 and over in the United States with a correlation coefficient (R) of -0.073 and weighted average of 65.3%, a difference of 1.1%.
In Labor Force | Age > 16 Correlation Summary
| Measurement | Slavic | Albanian |
| Minimum | 26.3% | 50.1% |
| Maximum | 76.4% | 76.2% |
| Range | 50.1% | 26.1% |
| Mean | 58.7% | 65.4% |
| Median | 61.2% | 65.3% |
| Interquartile 25% (IQ1) | 51.8% | 63.7% |
| Interquartile 75% (IQ3) | 65.8% | 67.4% |
| Interquartile Range (IQR) | 14.0% | 3.7% |
| Standard Deviation (Sample) | 10.3% | 4.2% |
| Standard Deviation (Population) | 10.2% | 4.2% |
Similar Demographics by In Labor Force | Age > 16
Demographics Similar to Slavs by In Labor Force | Age > 16
In terms of in labor force | age > 16, the demographic groups most similar to Slavs are Vietnamese (64.6%, a difference of 0.010%), Austrian (64.6%, a difference of 0.020%), Immigrants from Norway (64.6%, a difference of 0.020%), Italian (64.6%, a difference of 0.020%), and African (64.6%, a difference of 0.050%).
| Demographics | Rating | Rank | In Labor Force | Age > 16 |
| Europeans | 8.3 /100 | #226 | Tragic 64.7% |
| Poles | 8.3 /100 | #227 | Tragic 64.7% |
| Northern Europeans | 8.2 /100 | #228 | Tragic 64.7% |
| British | 7.3 /100 | #229 | Tragic 64.7% |
| Chinese | 7.3 /100 | #230 | Tragic 64.7% |
| Immigrants | Northern Europe | 7.2 /100 | #231 | Tragic 64.7% |
| Africans | 5.8 /100 | #232 | Tragic 64.6% |
| Slavs | 4.9 /100 | #233 | Tragic 64.6% |
| Vietnamese | 4.7 /100 | #234 | Tragic 64.6% |
| Austrians | 4.6 /100 | #235 | Tragic 64.6% |
| Immigrants | Norway | 4.6 /100 | #236 | Tragic 64.6% |
| Italians | 4.6 /100 | #237 | Tragic 64.6% |
| Lebanese | 3.9 /100 | #238 | Tragic 64.5% |
| Immigrants | Hungary | 3.8 /100 | #239 | Tragic 64.5% |
| Immigrants | Bangladesh | 3.6 /100 | #240 | Tragic 64.5% |
Demographics Similar to Albanians by In Labor Force | Age > 16
In terms of in labor force | age > 16, the demographic groups most similar to Albanians are Australian (65.3%, a difference of 0.010%), South African (65.3%, a difference of 0.010%), Danish (65.3%, a difference of 0.030%), Immigrants from South Africa (65.3%, a difference of 0.040%), and Immigrants from Kazakhstan (65.3%, a difference of 0.040%).
| Demographics | Rating | Rank | In Labor Force | Age > 16 |
| Immigrants | Armenia | 76.6 /100 | #155 | Good 65.3% |
| Immigrants | Ireland | 75.9 /100 | #156 | Good 65.3% |
| Immigrants | Russia | 75.7 /100 | #157 | Good 65.3% |
| Panamanians | 75.2 /100 | #158 | Good 65.3% |
| Immigrants | Syria | 74.6 /100 | #159 | Good 65.3% |
| Immigrants | South Africa | 73.5 /100 | #160 | Good 65.3% |
| Australians | 71.3 /100 | #161 | Good 65.3% |
| Albanians | 70.8 /100 | #162 | Good 65.3% |
| South Africans | 69.8 /100 | #163 | Good 65.3% |
| Danes | 68.8 /100 | #164 | Good 65.3% |
| Immigrants | Kazakhstan | 68.1 /100 | #165 | Good 65.3% |
| Immigrants | Western Asia | 67.3 /100 | #166 | Good 65.3% |
| Immigrants | Belarus | 66.0 /100 | #167 | Good 65.2% |
| Serbians | 63.5 /100 | #168 | Good 65.2% |
| Arabs | 62.4 /100 | #169 | Good 65.2% |