Eastern European vs Puget Sound Salish In Labor Force | Age > 16
COMPARE
Eastern European
Puget Sound Salish
In Labor Force | Age > 16
In Labor Force | Age > 16 Comparison
Eastern Europeans
Puget Sound Salish
65.1%
IN LABOR FORCE | AGE > 16
46.2/ 100
METRIC RATING
177th/ 347
METRIC RANK
63.7%
IN LABOR FORCE | AGE > 16
0.0/ 100
METRIC RATING
294th/ 347
METRIC RANK
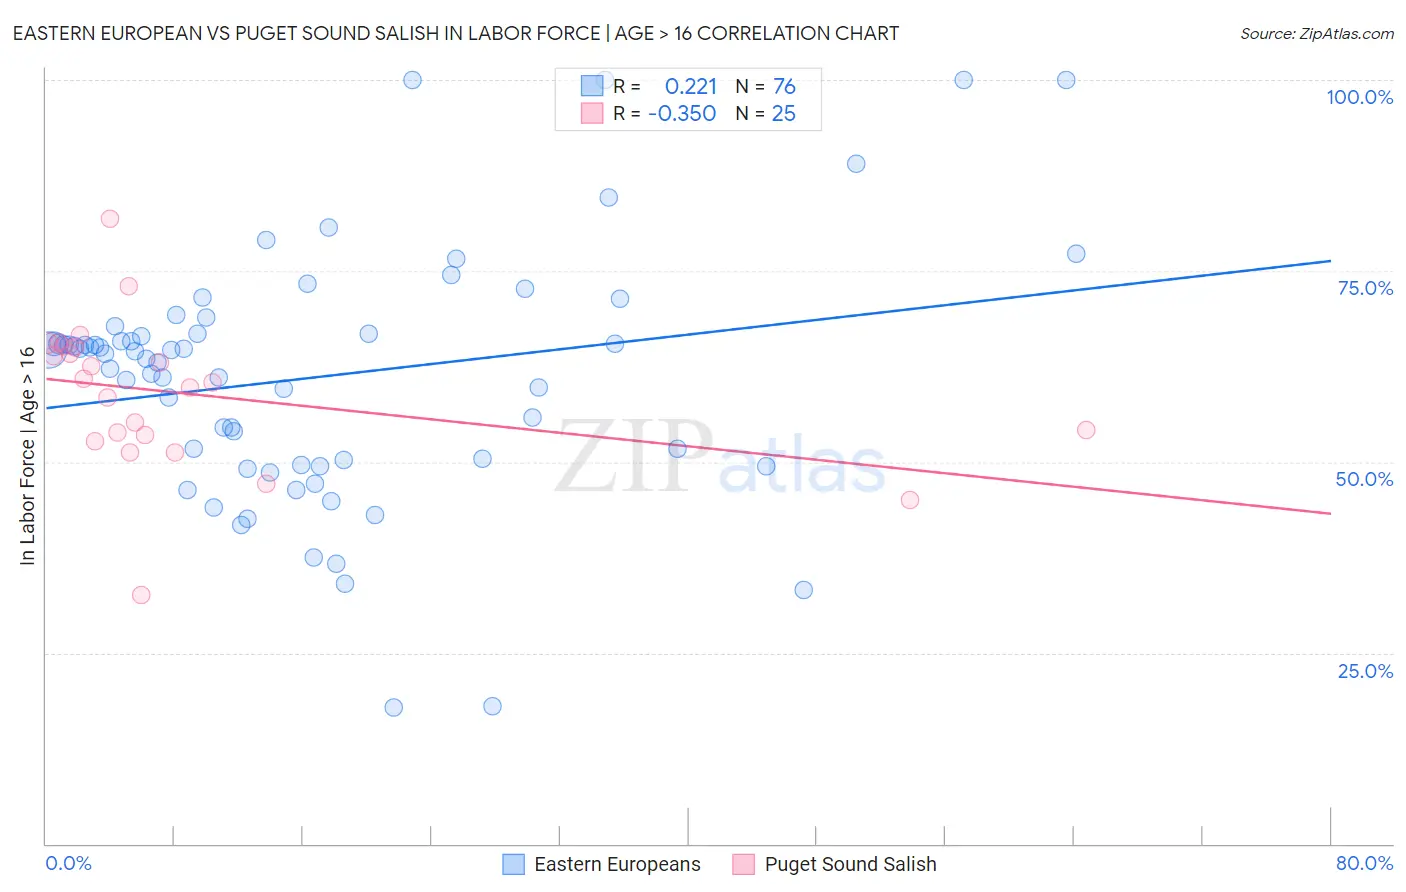
Eastern European vs Puget Sound Salish In Labor Force | Age > 16 Correlation Chart
The statistical analysis conducted on geographies consisting of 461,261,446 people shows a weak positive correlation between the proportion of Eastern Europeans and labor force participation rate among population ages 16 and over in the United States with a correlation coefficient (R) of 0.221 and weighted average of 65.1%. Similarly, the statistical analysis conducted on geographies consisting of 46,155,746 people shows a mild negative correlation between the proportion of Puget Sound Salish and labor force participation rate among population ages 16 and over in the United States with a correlation coefficient (R) of -0.350 and weighted average of 63.7%, a difference of 2.1%.
In Labor Force | Age > 16 Correlation Summary
| Measurement | Eastern European | Puget Sound Salish |
| Minimum | 17.9% | 32.5% |
| Maximum | 100.0% | 81.9% |
| Range | 82.1% | 49.4% |
| Mean | 61.1% | 58.9% |
| Median | 64.3% | 60.4% |
| Interquartile 25% (IQ1) | 49.9% | 53.1% |
| Interquartile 75% (IQ3) | 66.8% | 65.1% |
| Interquartile Range (IQR) | 16.9% | 12.0% |
| Standard Deviation (Sample) | 16.2% | 9.8% |
| Standard Deviation (Population) | 16.1% | 9.6% |
Similar Demographics by In Labor Force | Age > 16
Demographics Similar to Eastern Europeans by In Labor Force | Age > 16
In terms of in labor force | age > 16, the demographic groups most similar to Eastern Europeans are Swedish (65.1%, a difference of 0.010%), Trinidadian and Tobagonian (65.1%, a difference of 0.010%), Immigrants from Haiti (65.1%, a difference of 0.030%), Macedonian (65.1%, a difference of 0.040%), and Nicaraguan (65.1%, a difference of 0.040%).
| Demographics | Rating | Rank | In Labor Force | Age > 16 |
| Immigrants | Israel | 61.7 /100 | #170 | Good 65.2% |
| Israelis | 61.6 /100 | #171 | Good 65.2% |
| Immigrants | Sweden | 61.3 /100 | #172 | Good 65.2% |
| Immigrants | Ukraine | 53.7 /100 | #173 | Average 65.1% |
| Macedonians | 50.0 /100 | #174 | Average 65.1% |
| Nicaraguans | 49.7 /100 | #175 | Average 65.1% |
| Swedes | 47.4 /100 | #176 | Average 65.1% |
| Eastern Europeans | 46.2 /100 | #177 | Average 65.1% |
| Trinidadians and Tobagonians | 45.2 /100 | #178 | Average 65.1% |
| Immigrants | Haiti | 43.3 /100 | #179 | Average 65.1% |
| Immigrants | Latvia | 42.9 /100 | #180 | Average 65.1% |
| Immigrants | Panama | 42.4 /100 | #181 | Average 65.1% |
| Immigrants | Nicaragua | 41.1 /100 | #182 | Average 65.1% |
| Soviet Union | 40.5 /100 | #183 | Average 65.0% |
| Carpatho Rusyns | 40.0 /100 | #184 | Average 65.0% |
Demographics Similar to Puget Sound Salish by In Labor Force | Age > 16
In terms of in labor force | age > 16, the demographic groups most similar to Puget Sound Salish are English (63.7%, a difference of 0.030%), Immigrants from Canada (63.7%, a difference of 0.050%), Spanish American Indian (63.8%, a difference of 0.070%), Immigrants from North America (63.7%, a difference of 0.070%), and Nepalese (63.8%, a difference of 0.13%).
| Demographics | Rating | Rank | In Labor Force | Age > 16 |
| Scottish | 0.1 /100 | #287 | Tragic 63.9% |
| Spanish | 0.1 /100 | #288 | Tragic 63.9% |
| Celtics | 0.1 /100 | #289 | Tragic 63.8% |
| Hungarians | 0.1 /100 | #290 | Tragic 63.8% |
| Nepalese | 0.1 /100 | #291 | Tragic 63.8% |
| Spanish American Indians | 0.1 /100 | #292 | Tragic 63.8% |
| English | 0.1 /100 | #293 | Tragic 63.7% |
| Puget Sound Salish | 0.0 /100 | #294 | Tragic 63.7% |
| Immigrants | Canada | 0.0 /100 | #295 | Tragic 63.7% |
| Immigrants | North America | 0.0 /100 | #296 | Tragic 63.7% |
| Immigrants | Grenada | 0.0 /100 | #297 | Tragic 63.6% |
| Comanche | 0.0 /100 | #298 | Tragic 63.6% |
| Whites/Caucasians | 0.0 /100 | #299 | Tragic 63.6% |
| Immigrants | Azores | 0.0 /100 | #300 | Tragic 63.6% |
| Spanish Americans | 0.0 /100 | #301 | Tragic 63.6% |