Slavic vs Immigrants from Liberia Unemployment Among Women with Children Under 6 years
COMPARE
Slavic
Immigrants from Liberia
Unemployment Among Women with Children Under 6 years
Unemployment Among Women with Children Under 6 years Comparison
Slavs
Immigrants from Liberia
7.7%
UNEMPLOYMENT AMONG WOMEN WITH CHILDREN UNDER 6 YEARS
32.4/ 100
METRIC RATING
193rd/ 347
METRIC RANK
8.4%
UNEMPLOYMENT AMONG WOMEN WITH CHILDREN UNDER 6 YEARS
0.3/ 100
METRIC RATING
261st/ 347
METRIC RANK
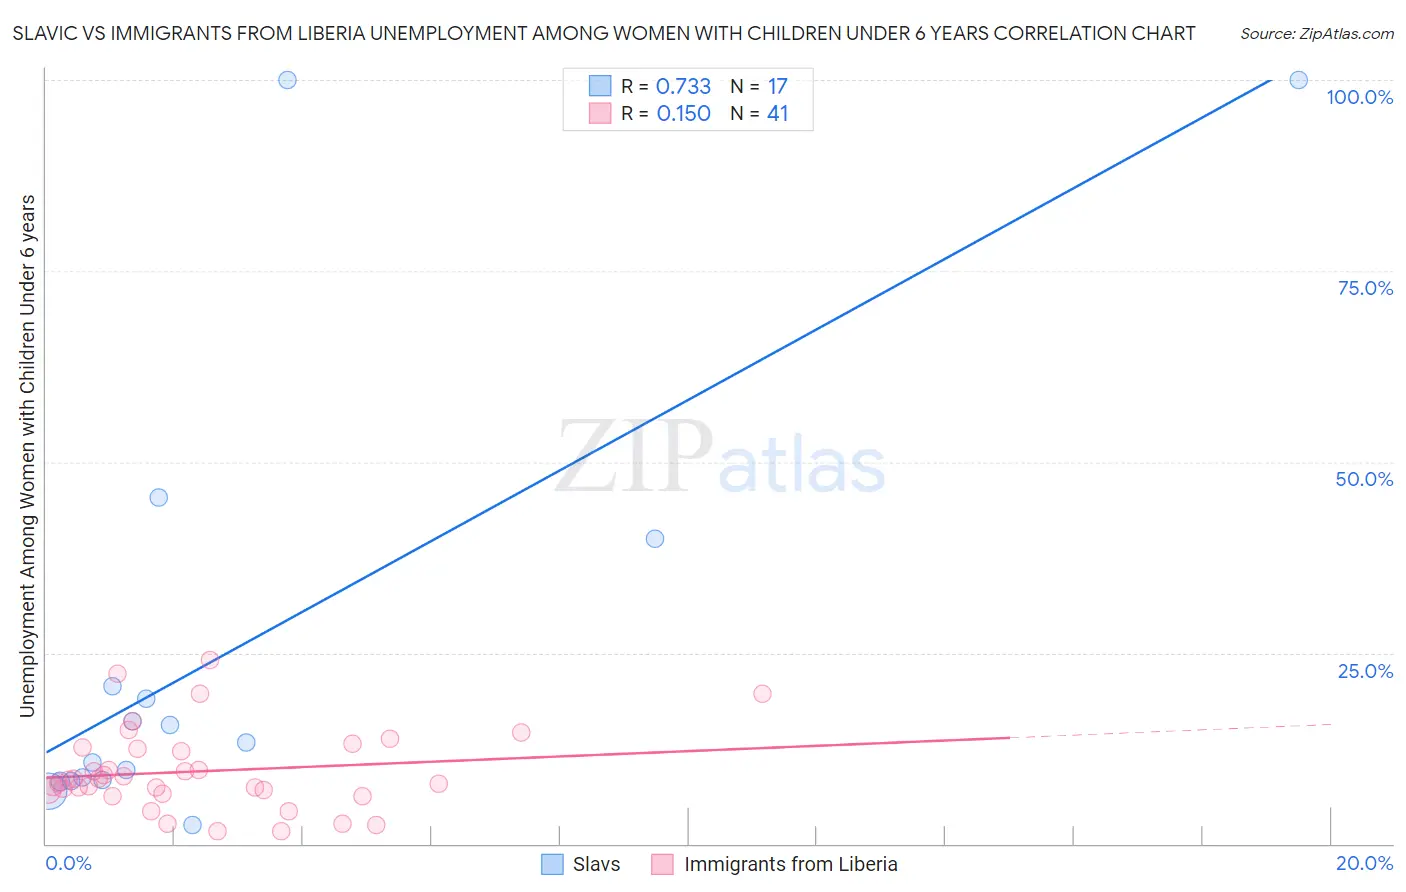
Slavic vs Immigrants from Liberia Unemployment Among Women with Children Under 6 years Correlation Chart
The statistical analysis conducted on geographies consisting of 210,803,228 people shows a strong positive correlation between the proportion of Slavs and unemployment rate among women with children under the age of 6 in the United States with a correlation coefficient (R) of 0.733 and weighted average of 7.7%. Similarly, the statistical analysis conducted on geographies consisting of 122,027,858 people shows a poor positive correlation between the proportion of Immigrants from Liberia and unemployment rate among women with children under the age of 6 in the United States with a correlation coefficient (R) of 0.150 and weighted average of 8.4%, a difference of 8.4%.
Unemployment Among Women with Children Under 6 years Correlation Summary
| Measurement | Slavic | Immigrants from Liberia |
| Minimum | 2.5% | 1.6% |
| Maximum | 100.0% | 24.0% |
| Range | 97.5% | 22.4% |
| Mean | 25.5% | 9.5% |
| Median | 13.3% | 8.3% |
| Interquartile 25% (IQ1) | 8.3% | 6.8% |
| Interquartile 75% (IQ3) | 30.3% | 12.5% |
| Interquartile Range (IQR) | 22.1% | 5.7% |
| Standard Deviation (Sample) | 30.2% | 5.3% |
| Standard Deviation (Population) | 29.3% | 5.3% |
Similar Demographics by Unemployment Among Women with Children Under 6 years
Demographics Similar to Slavs by Unemployment Among Women with Children Under 6 years
In terms of unemployment among women with children under 6 years, the demographic groups most similar to Slavs are Immigrants from Africa (7.7%, a difference of 0.0%), Immigrants from Austria (7.7%, a difference of 0.010%), Syrian (7.7%, a difference of 0.040%), Malaysian (7.7%, a difference of 0.10%), and Immigrants from St. Vincent and the Grenadines (7.7%, a difference of 0.10%).
| Demographics | Rating | Rank | Unemployment Among Women with Children Under 6 years |
| Yugoslavians | 39.4 /100 | #186 | Fair 7.7% |
| Immigrants | Thailand | 38.5 /100 | #187 | Fair 7.7% |
| Czechoslovakians | 38.4 /100 | #188 | Fair 7.7% |
| Immigrants | Panama | 35.7 /100 | #189 | Fair 7.7% |
| Immigrants | North Macedonia | 34.4 /100 | #190 | Fair 7.7% |
| Immigrants | Austria | 32.4 /100 | #191 | Fair 7.7% |
| Immigrants | Africa | 32.4 /100 | #192 | Fair 7.7% |
| Slavs | 32.4 /100 | #193 | Fair 7.7% |
| Syrians | 31.9 /100 | #194 | Fair 7.7% |
| Malaysians | 31.1 /100 | #195 | Fair 7.7% |
| Immigrants | St. Vincent and the Grenadines | 31.1 /100 | #196 | Fair 7.7% |
| Italians | 30.4 /100 | #197 | Fair 7.7% |
| Lithuanians | 30.0 /100 | #198 | Fair 7.8% |
| Immigrants | Poland | 27.3 /100 | #199 | Fair 7.8% |
| Guamanians/Chamorros | 25.5 /100 | #200 | Fair 7.8% |
Demographics Similar to Immigrants from Liberia by Unemployment Among Women with Children Under 6 years
In terms of unemployment among women with children under 6 years, the demographic groups most similar to Immigrants from Liberia are West Indian (8.4%, a difference of 0.010%), Scotch-Irish (8.4%, a difference of 0.040%), Honduran (8.4%, a difference of 0.060%), French Canadian (8.4%, a difference of 0.11%), and Immigrants from Honduras (8.4%, a difference of 0.12%).
| Demographics | Rating | Rank | Unemployment Among Women with Children Under 6 years |
| Immigrants | Caribbean | 0.7 /100 | #254 | Tragic 8.3% |
| Immigrants | Portugal | 0.6 /100 | #255 | Tragic 8.3% |
| Celtics | 0.6 /100 | #256 | Tragic 8.3% |
| British West Indians | 0.5 /100 | #257 | Tragic 8.3% |
| Immigrants | Ghana | 0.5 /100 | #258 | Tragic 8.3% |
| Barbadians | 0.4 /100 | #259 | Tragic 8.3% |
| Whites/Caucasians | 0.3 /100 | #260 | Tragic 8.4% |
| Immigrants | Liberia | 0.3 /100 | #261 | Tragic 8.4% |
| West Indians | 0.3 /100 | #262 | Tragic 8.4% |
| Scotch-Irish | 0.3 /100 | #263 | Tragic 8.4% |
| Hondurans | 0.3 /100 | #264 | Tragic 8.4% |
| French Canadians | 0.3 /100 | #265 | Tragic 8.4% |
| Immigrants | Honduras | 0.3 /100 | #266 | Tragic 8.4% |
| Belizeans | 0.2 /100 | #267 | Tragic 8.4% |
| Sub-Saharan Africans | 0.2 /100 | #268 | Tragic 8.4% |