Sioux vs Alaskan Athabascan In Labor Force | Age 25-29
COMPARE
Sioux
Alaskan Athabascan
In Labor Force | Age 25-29
In Labor Force | Age 25-29 Comparison
Sioux
Alaskan Athabascans
79.7%
IN LABOR FORCE | AGE 25-29
0.0/ 100
METRIC RATING
333rd/ 347
METRIC RANK
82.3%
IN LABOR FORCE | AGE 25-29
0.0/ 100
METRIC RATING
311th/ 347
METRIC RANK
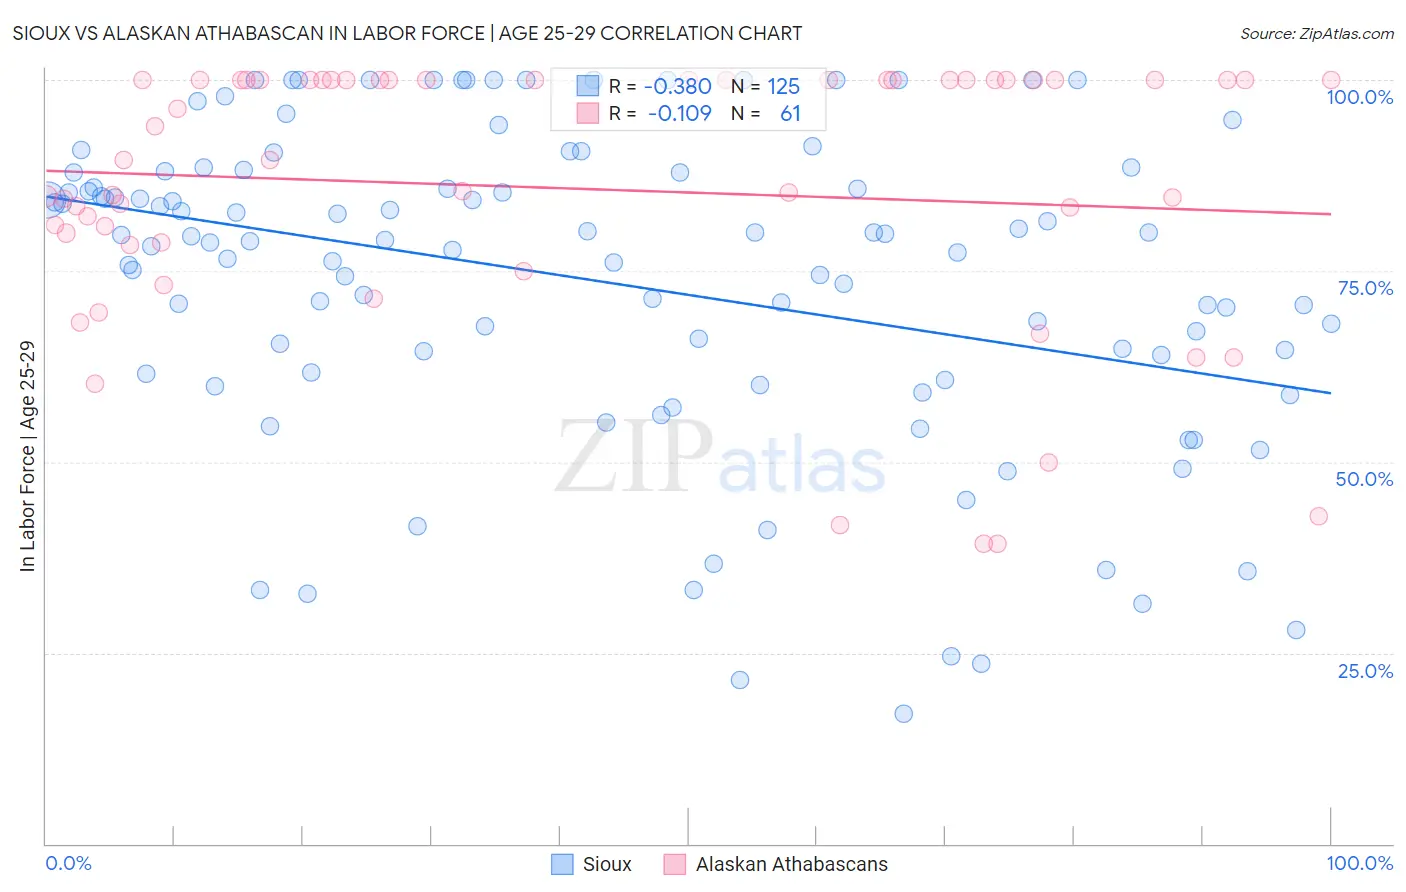
Sioux vs Alaskan Athabascan In Labor Force | Age 25-29 Correlation Chart
The statistical analysis conducted on geographies consisting of 234,111,453 people shows a mild negative correlation between the proportion of Sioux and labor force participation rate among population between the ages 25 and 29 in the United States with a correlation coefficient (R) of -0.380 and weighted average of 79.7%. Similarly, the statistical analysis conducted on geographies consisting of 45,810,545 people shows a poor negative correlation between the proportion of Alaskan Athabascans and labor force participation rate among population between the ages 25 and 29 in the United States with a correlation coefficient (R) of -0.109 and weighted average of 82.3%, a difference of 3.3%.
In Labor Force | Age 25-29 Correlation Summary
| Measurement | Sioux | Alaskan Athabascan |
| Minimum | 17.0% | 39.3% |
| Maximum | 100.0% | 100.0% |
| Range | 83.0% | 60.7% |
| Mean | 73.7% | 85.8% |
| Median | 78.9% | 89.5% |
| Interquartile 25% (IQ1) | 61.6% | 78.6% |
| Interquartile 75% (IQ3) | 87.9% | 100.0% |
| Interquartile Range (IQR) | 26.3% | 21.4% |
| Standard Deviation (Sample) | 20.5% | 17.6% |
| Standard Deviation (Population) | 20.4% | 17.4% |
Similar Demographics by In Labor Force | Age 25-29
Demographics Similar to Sioux by In Labor Force | Age 25-29
In terms of in labor force | age 25-29, the demographic groups most similar to Sioux are Inupiat (79.8%, a difference of 0.11%), Yuman (79.3%, a difference of 0.42%), Native/Alaskan (79.3%, a difference of 0.50%), Apache (79.2%, a difference of 0.57%), and Cheyenne (80.3%, a difference of 0.80%).
| Demographics | Rating | Rank | In Labor Force | Age 25-29 |
| Choctaw | 0.0 /100 | #326 | Tragic 81.0% |
| Ute | 0.0 /100 | #327 | Tragic 80.8% |
| Creek | 0.0 /100 | #328 | Tragic 80.7% |
| Yakama | 0.0 /100 | #329 | Tragic 80.6% |
| Puerto Ricans | 0.0 /100 | #330 | Tragic 80.4% |
| Cheyenne | 0.0 /100 | #331 | Tragic 80.3% |
| Inupiat | 0.0 /100 | #332 | Tragic 79.8% |
| Sioux | 0.0 /100 | #333 | Tragic 79.7% |
| Yuman | 0.0 /100 | #334 | Tragic 79.3% |
| Natives/Alaskans | 0.0 /100 | #335 | Tragic 79.3% |
| Apache | 0.0 /100 | #336 | Tragic 79.2% |
| Crow | 0.0 /100 | #337 | Tragic 78.6% |
| Lumbee | 0.0 /100 | #338 | Tragic 78.3% |
| Immigrants | Yemen | 0.0 /100 | #339 | Tragic 78.2% |
| Paiute | 0.0 /100 | #340 | Tragic 78.1% |
Demographics Similar to Alaskan Athabascans by In Labor Force | Age 25-29
In terms of in labor force | age 25-29, the demographic groups most similar to Alaskan Athabascans are Osage (82.3%, a difference of 0.010%), Hispanic or Latino (82.2%, a difference of 0.070%), Immigrants from Central America (82.4%, a difference of 0.15%), Central American Indian (82.4%, a difference of 0.16%), and Yaqui (82.2%, a difference of 0.17%).
| Demographics | Rating | Rank | In Labor Force | Age 25-29 |
| Immigrants | St. Vincent and the Grenadines | 0.0 /100 | #304 | Tragic 82.7% |
| Blacks/African Americans | 0.0 /100 | #305 | Tragic 82.6% |
| Blackfeet | 0.0 /100 | #306 | Tragic 82.6% |
| Cajuns | 0.0 /100 | #307 | Tragic 82.5% |
| Central American Indians | 0.0 /100 | #308 | Tragic 82.4% |
| Immigrants | Central America | 0.0 /100 | #309 | Tragic 82.4% |
| Osage | 0.0 /100 | #310 | Tragic 82.3% |
| Alaskan Athabascans | 0.0 /100 | #311 | Tragic 82.3% |
| Hispanics or Latinos | 0.0 /100 | #312 | Tragic 82.2% |
| Yaqui | 0.0 /100 | #313 | Tragic 82.2% |
| Cherokee | 0.0 /100 | #314 | Tragic 82.1% |
| Immigrants | Mexico | 0.0 /100 | #315 | Tragic 82.0% |
| Mexicans | 0.0 /100 | #316 | Tragic 81.9% |
| Chickasaw | 0.0 /100 | #317 | Tragic 81.9% |
| Comanche | 0.0 /100 | #318 | Tragic 81.9% |