Cajun vs Nigerian In Labor Force | Age 25-29
COMPARE
Cajun
Nigerian
In Labor Force | Age 25-29
In Labor Force | Age 25-29 Comparison
Cajuns
Nigerians
82.5%
IN LABOR FORCE | AGE 25-29
0.0/ 100
METRIC RATING
307th/ 347
METRIC RANK
84.3%
IN LABOR FORCE | AGE 25-29
7.2/ 100
METRIC RATING
220th/ 347
METRIC RANK
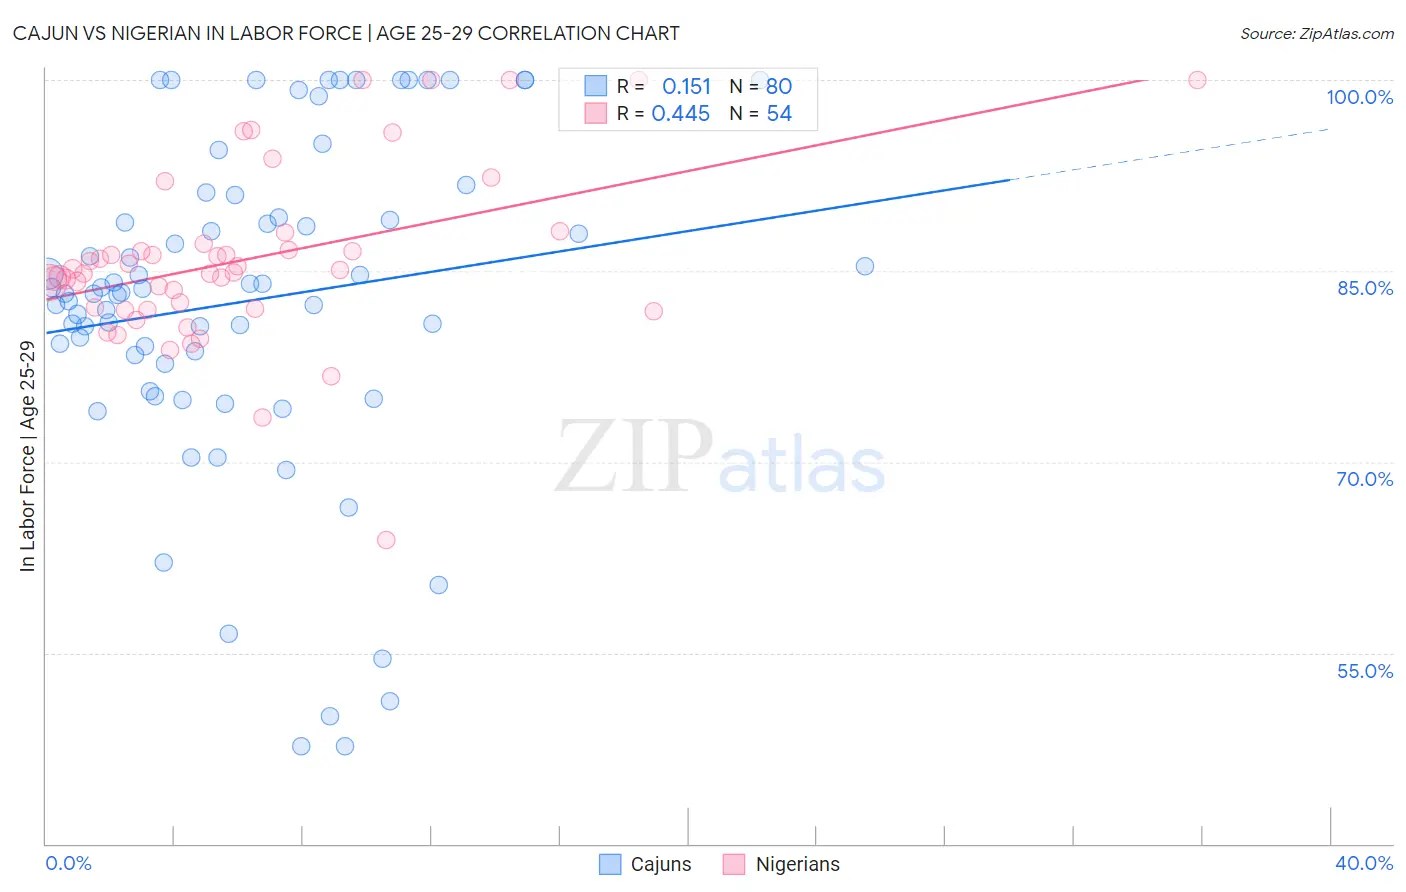
Cajun vs Nigerian In Labor Force | Age 25-29 Correlation Chart
The statistical analysis conducted on geographies consisting of 149,675,482 people shows a poor positive correlation between the proportion of Cajuns and labor force participation rate among population between the ages 25 and 29 in the United States with a correlation coefficient (R) of 0.151 and weighted average of 82.5%. Similarly, the statistical analysis conducted on geographies consisting of 332,698,985 people shows a moderate positive correlation between the proportion of Nigerians and labor force participation rate among population between the ages 25 and 29 in the United States with a correlation coefficient (R) of 0.445 and weighted average of 84.3%, a difference of 2.1%.
In Labor Force | Age 25-29 Correlation Summary
| Measurement | Cajun | Nigerian |
| Minimum | 47.7% | 63.9% |
| Maximum | 100.0% | 100.0% |
| Range | 52.3% | 36.1% |
| Mean | 82.7% | 85.9% |
| Median | 83.4% | 85.0% |
| Interquartile 25% (IQ1) | 78.0% | 82.0% |
| Interquartile 75% (IQ3) | 90.1% | 87.1% |
| Interquartile Range (IQR) | 12.1% | 5.1% |
| Standard Deviation (Sample) | 13.1% | 6.9% |
| Standard Deviation (Population) | 13.0% | 6.9% |
Similar Demographics by In Labor Force | Age 25-29
Demographics Similar to Cajuns by In Labor Force | Age 25-29
In terms of in labor force | age 25-29, the demographic groups most similar to Cajuns are Black/African American (82.6%, a difference of 0.060%), Blackfeet (82.6%, a difference of 0.060%), Central American Indian (82.4%, a difference of 0.15%), Immigrants from Central America (82.4%, a difference of 0.16%), and Immigrants from St. Vincent and the Grenadines (82.7%, a difference of 0.18%).
| Demographics | Rating | Rank | In Labor Force | Age 25-29 |
| Spanish American Indians | 0.0 /100 | #300 | Tragic 82.9% |
| Vietnamese | 0.0 /100 | #301 | Tragic 82.8% |
| Immigrants | Belize | 0.0 /100 | #302 | Tragic 82.8% |
| Immigrants | Grenada | 0.0 /100 | #303 | Tragic 82.8% |
| Immigrants | St. Vincent and the Grenadines | 0.0 /100 | #304 | Tragic 82.7% |
| Blacks/African Americans | 0.0 /100 | #305 | Tragic 82.6% |
| Blackfeet | 0.0 /100 | #306 | Tragic 82.6% |
| Cajuns | 0.0 /100 | #307 | Tragic 82.5% |
| Central American Indians | 0.0 /100 | #308 | Tragic 82.4% |
| Immigrants | Central America | 0.0 /100 | #309 | Tragic 82.4% |
| Osage | 0.0 /100 | #310 | Tragic 82.3% |
| Alaskan Athabascans | 0.0 /100 | #311 | Tragic 82.3% |
| Hispanics or Latinos | 0.0 /100 | #312 | Tragic 82.2% |
| Yaqui | 0.0 /100 | #313 | Tragic 82.2% |
| Cherokee | 0.0 /100 | #314 | Tragic 82.1% |
Demographics Similar to Nigerians by In Labor Force | Age 25-29
In terms of in labor force | age 25-29, the demographic groups most similar to Nigerians are Arab (84.2%, a difference of 0.010%), Jordanian (84.2%, a difference of 0.010%), Scotch-Irish (84.2%, a difference of 0.020%), Immigrants from Nigeria (84.3%, a difference of 0.040%), and Immigrants from Saudi Arabia (84.3%, a difference of 0.040%).
| Demographics | Rating | Rank | In Labor Force | Age 25-29 |
| Japanese | 11.4 /100 | #213 | Poor 84.3% |
| Lebanese | 11.1 /100 | #214 | Poor 84.3% |
| Immigrants | Syria | 10.7 /100 | #215 | Poor 84.3% |
| Israelis | 9.3 /100 | #216 | Tragic 84.3% |
| Immigrants | Ecuador | 9.3 /100 | #217 | Tragic 84.3% |
| Immigrants | Nigeria | 9.0 /100 | #218 | Tragic 84.3% |
| Immigrants | Saudi Arabia | 8.8 /100 | #219 | Tragic 84.3% |
| Nigerians | 7.2 /100 | #220 | Tragic 84.3% |
| Arabs | 6.8 /100 | #221 | Tragic 84.2% |
| Jordanians | 6.7 /100 | #222 | Tragic 84.2% |
| Scotch-Irish | 6.5 /100 | #223 | Tragic 84.2% |
| Immigrants | West Indies | 6.0 /100 | #224 | Tragic 84.2% |
| Koreans | 5.9 /100 | #225 | Tragic 84.2% |
| Immigrants | Congo | 5.8 /100 | #226 | Tragic 84.2% |
| French American Indians | 5.5 /100 | #227 | Tragic 84.2% |