German vs Nigerian In Labor Force | Age 25-29
COMPARE
German
Nigerian
In Labor Force | Age 25-29
In Labor Force | Age 25-29 Comparison
Germans
Nigerians
85.3%
IN LABOR FORCE | AGE 25-29
98.1/ 100
METRIC RATING
76th/ 347
METRIC RANK
84.3%
IN LABOR FORCE | AGE 25-29
7.2/ 100
METRIC RATING
220th/ 347
METRIC RANK
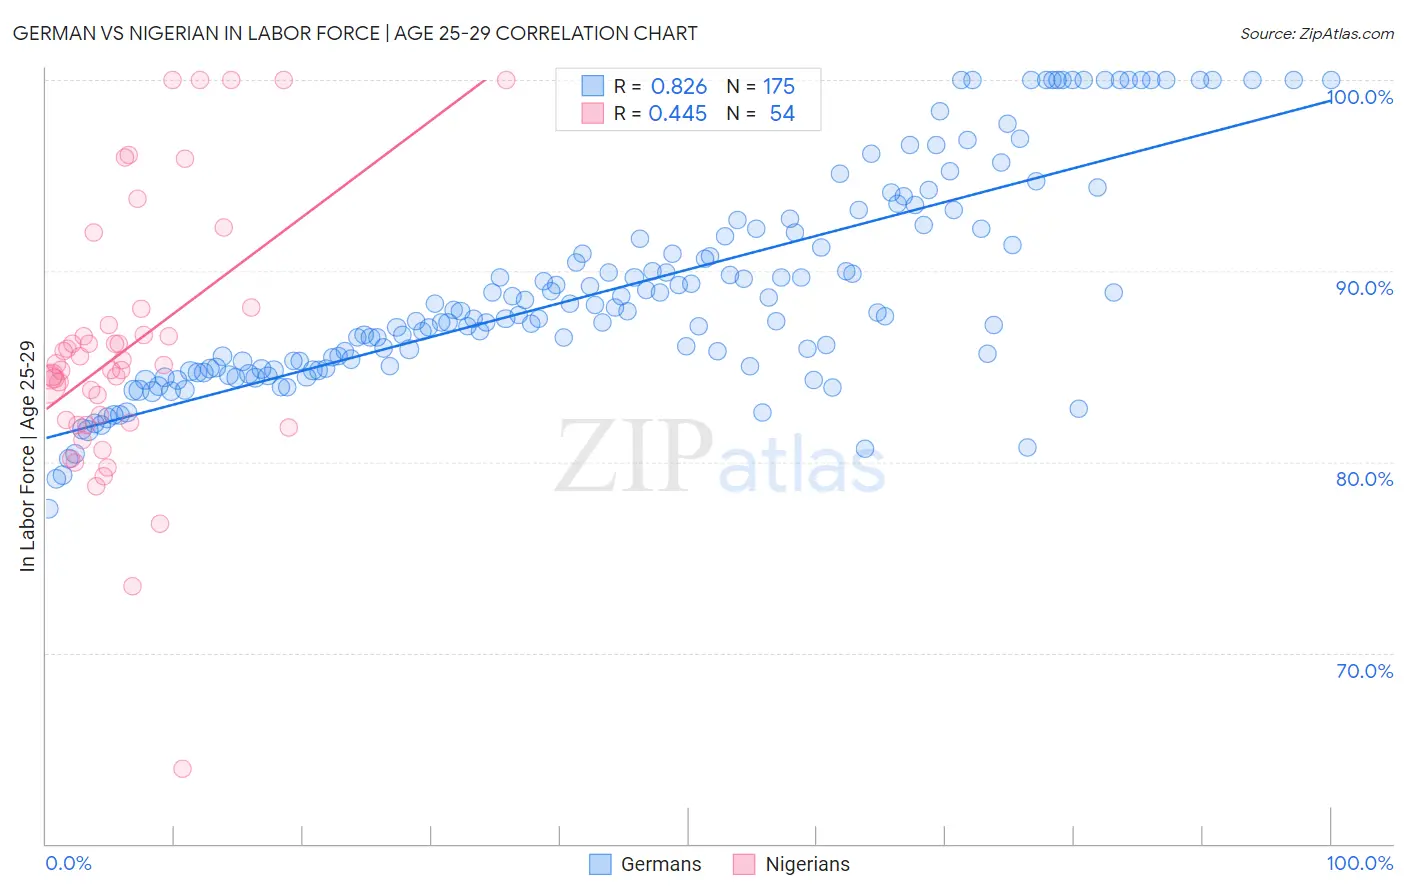
German vs Nigerian In Labor Force | Age 25-29 Correlation Chart
The statistical analysis conducted on geographies consisting of 579,041,813 people shows a very strong positive correlation between the proportion of Germans and labor force participation rate among population between the ages 25 and 29 in the United States with a correlation coefficient (R) of 0.826 and weighted average of 85.3%. Similarly, the statistical analysis conducted on geographies consisting of 332,698,985 people shows a moderate positive correlation between the proportion of Nigerians and labor force participation rate among population between the ages 25 and 29 in the United States with a correlation coefficient (R) of 0.445 and weighted average of 84.3%, a difference of 1.2%.
In Labor Force | Age 25-29 Correlation Summary
| Measurement | German | Nigerian |
| Minimum | 77.6% | 63.9% |
| Maximum | 100.0% | 100.0% |
| Range | 22.4% | 36.1% |
| Mean | 89.0% | 85.9% |
| Median | 87.7% | 85.0% |
| Interquartile 25% (IQ1) | 84.9% | 82.0% |
| Interquartile 75% (IQ3) | 92.2% | 87.1% |
| Interquartile Range (IQR) | 7.3% | 5.1% |
| Standard Deviation (Sample) | 5.5% | 6.9% |
| Standard Deviation (Population) | 5.5% | 6.9% |
Similar Demographics by In Labor Force | Age 25-29
Demographics Similar to Germans by In Labor Force | Age 25-29
In terms of in labor force | age 25-29, the demographic groups most similar to Germans are Brazilian (85.3%, a difference of 0.020%), Immigrants from South Central Asia (85.2%, a difference of 0.020%), Immigrants from Egypt (85.2%, a difference of 0.030%), Immigrants from Northern Africa (85.2%, a difference of 0.040%), and Immigrants from Zimbabwe (85.2%, a difference of 0.040%).
| Demographics | Rating | Rank | In Labor Force | Age 25-29 |
| Menominee | 99.1 /100 | #69 | Exceptional 85.4% |
| Immigrants | Sweden | 99.1 /100 | #70 | Exceptional 85.4% |
| Kenyans | 99.0 /100 | #71 | Exceptional 85.4% |
| Immigrants | Australia | 98.9 /100 | #72 | Exceptional 85.3% |
| Russians | 98.8 /100 | #73 | Exceptional 85.3% |
| Soviet Union | 98.5 /100 | #74 | Exceptional 85.3% |
| Brazilians | 98.3 /100 | #75 | Exceptional 85.3% |
| Germans | 98.1 /100 | #76 | Exceptional 85.3% |
| Immigrants | South Central Asia | 97.9 /100 | #77 | Exceptional 85.2% |
| Immigrants | Egypt | 97.7 /100 | #78 | Exceptional 85.2% |
| Immigrants | Northern Africa | 97.6 /100 | #79 | Exceptional 85.2% |
| Immigrants | Zimbabwe | 97.6 /100 | #80 | Exceptional 85.2% |
| Immigrants | Northern Europe | 97.2 /100 | #81 | Exceptional 85.2% |
| Okinawans | 97.0 /100 | #82 | Exceptional 85.2% |
| Immigrants | Europe | 96.8 /100 | #83 | Exceptional 85.2% |
Demographics Similar to Nigerians by In Labor Force | Age 25-29
In terms of in labor force | age 25-29, the demographic groups most similar to Nigerians are Arab (84.2%, a difference of 0.010%), Jordanian (84.2%, a difference of 0.010%), Scotch-Irish (84.2%, a difference of 0.020%), Immigrants from Nigeria (84.3%, a difference of 0.040%), and Immigrants from Saudi Arabia (84.3%, a difference of 0.040%).
| Demographics | Rating | Rank | In Labor Force | Age 25-29 |
| Japanese | 11.4 /100 | #213 | Poor 84.3% |
| Lebanese | 11.1 /100 | #214 | Poor 84.3% |
| Immigrants | Syria | 10.7 /100 | #215 | Poor 84.3% |
| Israelis | 9.3 /100 | #216 | Tragic 84.3% |
| Immigrants | Ecuador | 9.3 /100 | #217 | Tragic 84.3% |
| Immigrants | Nigeria | 9.0 /100 | #218 | Tragic 84.3% |
| Immigrants | Saudi Arabia | 8.8 /100 | #219 | Tragic 84.3% |
| Nigerians | 7.2 /100 | #220 | Tragic 84.3% |
| Arabs | 6.8 /100 | #221 | Tragic 84.2% |
| Jordanians | 6.7 /100 | #222 | Tragic 84.2% |
| Scotch-Irish | 6.5 /100 | #223 | Tragic 84.2% |
| Immigrants | West Indies | 6.0 /100 | #224 | Tragic 84.2% |
| Koreans | 5.9 /100 | #225 | Tragic 84.2% |
| Immigrants | Congo | 5.8 /100 | #226 | Tragic 84.2% |
| French American Indians | 5.5 /100 | #227 | Tragic 84.2% |