Sioux vs Immigrants from Yemen In Labor Force | Age 25-29
COMPARE
Sioux
Immigrants from Yemen
In Labor Force | Age 25-29
In Labor Force | Age 25-29 Comparison
Sioux
Immigrants from Yemen
79.7%
IN LABOR FORCE | AGE 25-29
0.0/ 100
METRIC RATING
333rd/ 347
METRIC RANK
78.2%
IN LABOR FORCE | AGE 25-29
0.0/ 100
METRIC RATING
339th/ 347
METRIC RANK
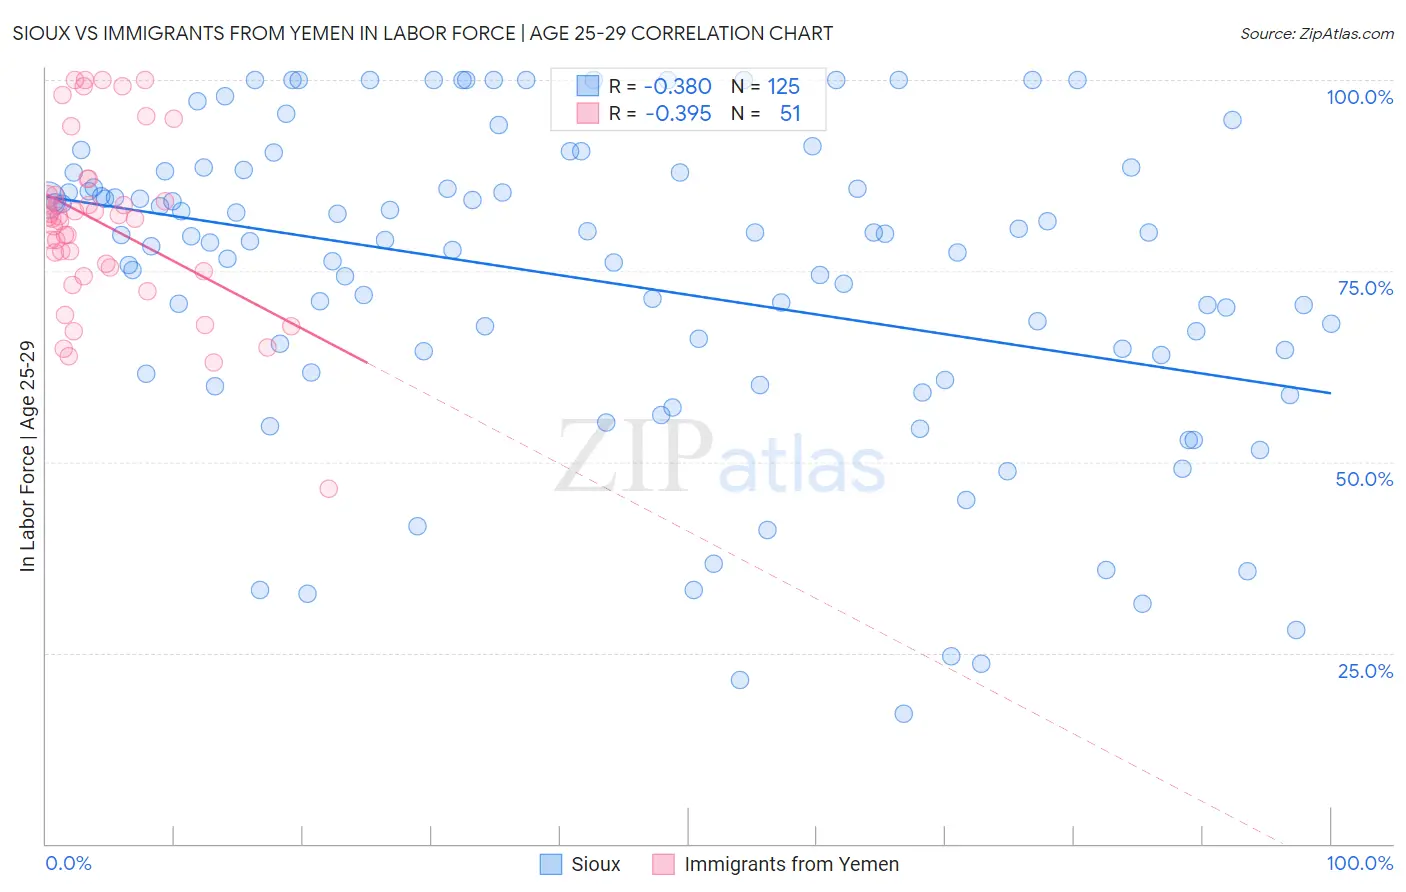
Sioux vs Immigrants from Yemen In Labor Force | Age 25-29 Correlation Chart
The statistical analysis conducted on geographies consisting of 234,111,453 people shows a mild negative correlation between the proportion of Sioux and labor force participation rate among population between the ages 25 and 29 in the United States with a correlation coefficient (R) of -0.380 and weighted average of 79.7%. Similarly, the statistical analysis conducted on geographies consisting of 82,433,611 people shows a mild negative correlation between the proportion of Immigrants from Yemen and labor force participation rate among population between the ages 25 and 29 in the United States with a correlation coefficient (R) of -0.395 and weighted average of 78.2%, a difference of 1.8%.
In Labor Force | Age 25-29 Correlation Summary
| Measurement | Sioux | Immigrants from Yemen |
| Minimum | 17.0% | 46.4% |
| Maximum | 100.0% | 100.0% |
| Range | 83.0% | 53.6% |
| Mean | 73.7% | 81.1% |
| Median | 78.9% | 81.9% |
| Interquartile 25% (IQ1) | 61.6% | 75.0% |
| Interquartile 75% (IQ3) | 87.9% | 85.0% |
| Interquartile Range (IQR) | 26.3% | 10.0% |
| Standard Deviation (Sample) | 20.5% | 11.4% |
| Standard Deviation (Population) | 20.4% | 11.2% |
Demographics Similar to Sioux and Immigrants from Yemen by In Labor Force | Age 25-29
In terms of in labor force | age 25-29, the demographic groups most similar to Sioux are Inupiat (79.8%, a difference of 0.11%), Yuman (79.3%, a difference of 0.42%), Native/Alaskan (79.3%, a difference of 0.50%), Apache (79.2%, a difference of 0.57%), and Cheyenne (80.3%, a difference of 0.80%). Similarly, the demographic groups most similar to Immigrants from Yemen are Lumbee (78.3%, a difference of 0.12%), Paiute (78.1%, a difference of 0.16%), Crow (78.6%, a difference of 0.49%), Tohono O'odham (77.5%, a difference of 0.94%), and Pueblo (77.5%, a difference of 0.96%).
| Demographics | Rating | Rank | In Labor Force | Age 25-29 |
| Choctaw | 0.0 /100 | #326 | Tragic 81.0% |
| Ute | 0.0 /100 | #327 | Tragic 80.8% |
| Creek | 0.0 /100 | #328 | Tragic 80.7% |
| Yakama | 0.0 /100 | #329 | Tragic 80.6% |
| Puerto Ricans | 0.0 /100 | #330 | Tragic 80.4% |
| Cheyenne | 0.0 /100 | #331 | Tragic 80.3% |
| Inupiat | 0.0 /100 | #332 | Tragic 79.8% |
| Sioux | 0.0 /100 | #333 | Tragic 79.7% |
| Yuman | 0.0 /100 | #334 | Tragic 79.3% |
| Natives/Alaskans | 0.0 /100 | #335 | Tragic 79.3% |
| Apache | 0.0 /100 | #336 | Tragic 79.2% |
| Crow | 0.0 /100 | #337 | Tragic 78.6% |
| Lumbee | 0.0 /100 | #338 | Tragic 78.3% |
| Immigrants | Yemen | 0.0 /100 | #339 | Tragic 78.2% |
| Paiute | 0.0 /100 | #340 | Tragic 78.1% |
| Tohono O'odham | 0.0 /100 | #341 | Tragic 77.5% |
| Pueblo | 0.0 /100 | #342 | Tragic 77.5% |
| Arapaho | 0.0 /100 | #343 | Tragic 76.6% |
| Hopi | 0.0 /100 | #344 | Tragic 76.5% |
| Navajo | 0.0 /100 | #345 | Tragic 74.6% |
| Pima | 0.0 /100 | #346 | Tragic 74.3% |