Sioux vs Immigrants from Singapore In Labor Force | Age 20-24
COMPARE
Sioux
Immigrants from Singapore
In Labor Force | Age 20-24
In Labor Force | Age 20-24 Comparison
Sioux
Immigrants from Singapore
74.6%
IN LABOR FORCE | AGE 20-24
17.5/ 100
METRIC RATING
206th/ 347
METRIC RANK
72.4%
IN LABOR FORCE | AGE 20-24
0.0/ 100
METRIC RATING
305th/ 347
METRIC RANK
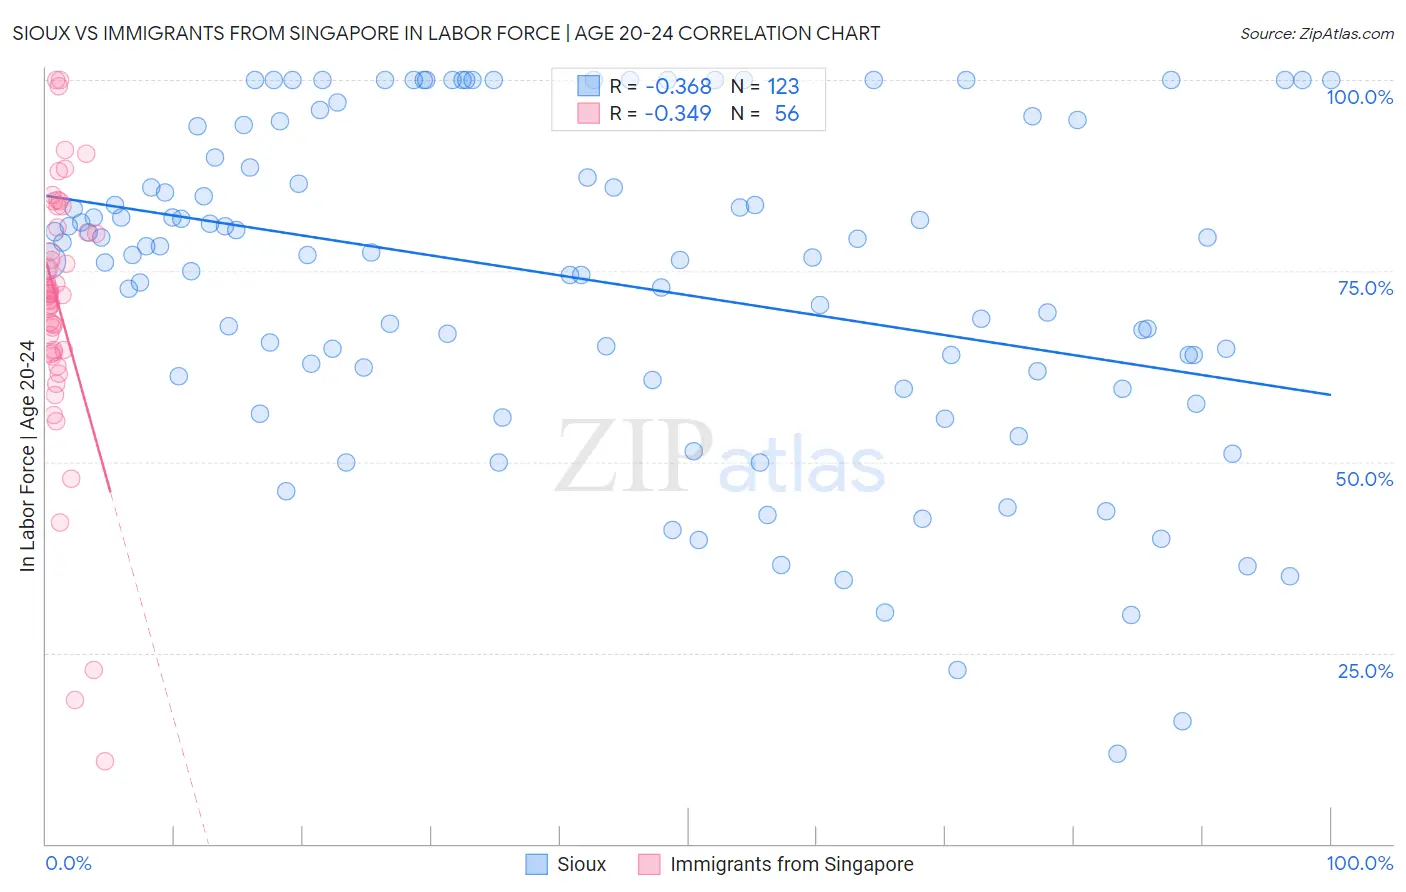
Sioux vs Immigrants from Singapore In Labor Force | Age 20-24 Correlation Chart
The statistical analysis conducted on geographies consisting of 234,099,226 people shows a mild negative correlation between the proportion of Sioux and labor force participation rate among population between the ages 20 and 24 in the United States with a correlation coefficient (R) of -0.368 and weighted average of 74.6%. Similarly, the statistical analysis conducted on geographies consisting of 137,517,565 people shows a mild negative correlation between the proportion of Immigrants from Singapore and labor force participation rate among population between the ages 20 and 24 in the United States with a correlation coefficient (R) of -0.349 and weighted average of 72.4%, a difference of 3.1%.
In Labor Force | Age 20-24 Correlation Summary
| Measurement | Sioux | Immigrants from Singapore |
| Minimum | 11.8% | 10.8% |
| Maximum | 100.0% | 100.0% |
| Range | 88.2% | 89.2% |
| Mean | 73.8% | 70.4% |
| Median | 77.4% | 71.9% |
| Interquartile 25% (IQ1) | 61.2% | 64.5% |
| Interquartile 75% (IQ3) | 93.9% | 80.3% |
| Interquartile Range (IQR) | 32.7% | 15.9% |
| Standard Deviation (Sample) | 21.4% | 17.3% |
| Standard Deviation (Population) | 21.3% | 17.2% |
Similar Demographics by In Labor Force | Age 20-24
Demographics Similar to Sioux by In Labor Force | Age 20-24
In terms of in labor force | age 20-24, the demographic groups most similar to Sioux are Immigrants from Italy (74.6%, a difference of 0.0%), Inupiat (74.6%, a difference of 0.0%), Immigrants from Northern Africa (74.6%, a difference of 0.010%), Albanian (74.6%, a difference of 0.030%), and Immigrants from Uruguay (74.6%, a difference of 0.040%).
| Demographics | Rating | Rank | In Labor Force | Age 20-24 |
| Taiwanese | 23.2 /100 | #199 | Fair 74.7% |
| Nigerians | 21.9 /100 | #200 | Fair 74.7% |
| Choctaw | 21.4 /100 | #201 | Fair 74.7% |
| Moroccans | 20.4 /100 | #202 | Fair 74.7% |
| Immigrants | Northern Africa | 17.9 /100 | #203 | Poor 74.6% |
| Immigrants | Italy | 17.6 /100 | #204 | Poor 74.6% |
| Inupiat | 17.6 /100 | #205 | Poor 74.6% |
| Sioux | 17.5 /100 | #206 | Poor 74.6% |
| Albanians | 16.2 /100 | #207 | Poor 74.6% |
| Immigrants | Uruguay | 15.8 /100 | #208 | Poor 74.6% |
| Arabs | 15.8 /100 | #209 | Poor 74.6% |
| Uruguayans | 15.1 /100 | #210 | Poor 74.6% |
| Immigrants | Australia | 14.7 /100 | #211 | Poor 74.6% |
| Creek | 13.3 /100 | #212 | Poor 74.5% |
| Peruvians | 13.3 /100 | #213 | Poor 74.5% |
Demographics Similar to Immigrants from Singapore by In Labor Force | Age 20-24
In terms of in labor force | age 20-24, the demographic groups most similar to Immigrants from Singapore are Immigrants from Jamaica (72.4%, a difference of 0.020%), Immigrants from West Indies (72.4%, a difference of 0.030%), Ecuadorian (72.4%, a difference of 0.040%), Native/Alaskan (72.4%, a difference of 0.050%), and Cuban (72.5%, a difference of 0.14%).
| Demographics | Rating | Rank | In Labor Force | Age 20-24 |
| Israelis | 0.0 /100 | #298 | Tragic 72.6% |
| Iranians | 0.0 /100 | #299 | Tragic 72.6% |
| Armenians | 0.0 /100 | #300 | Tragic 72.5% |
| Cubans | 0.0 /100 | #301 | Tragic 72.5% |
| Natives/Alaskans | 0.0 /100 | #302 | Tragic 72.4% |
| Ecuadorians | 0.0 /100 | #303 | Tragic 72.4% |
| Immigrants | West Indies | 0.0 /100 | #304 | Tragic 72.4% |
| Immigrants | Singapore | 0.0 /100 | #305 | Tragic 72.4% |
| Immigrants | Jamaica | 0.0 /100 | #306 | Tragic 72.4% |
| Immigrants | Ecuador | 0.0 /100 | #307 | Tragic 72.3% |
| Soviet Union | 0.0 /100 | #308 | Tragic 72.3% |
| Tsimshian | 0.0 /100 | #309 | Tragic 72.3% |
| Immigrants | Cuba | 0.0 /100 | #310 | Tragic 72.0% |
| Apache | 0.0 /100 | #311 | Tragic 72.0% |
| Immigrants | Caribbean | 0.0 /100 | #312 | Tragic 71.9% |