Sioux vs Hmong In Labor Force | Age 20-24
COMPARE
Sioux
Hmong
In Labor Force | Age 20-24
In Labor Force | Age 20-24 Comparison
Sioux
Hmong
74.6%
IN LABOR FORCE | AGE 20-24
17.5/ 100
METRIC RATING
206th/ 347
METRIC RANK
76.5%
IN LABOR FORCE | AGE 20-24
99.5/ 100
METRIC RATING
82nd/ 347
METRIC RANK
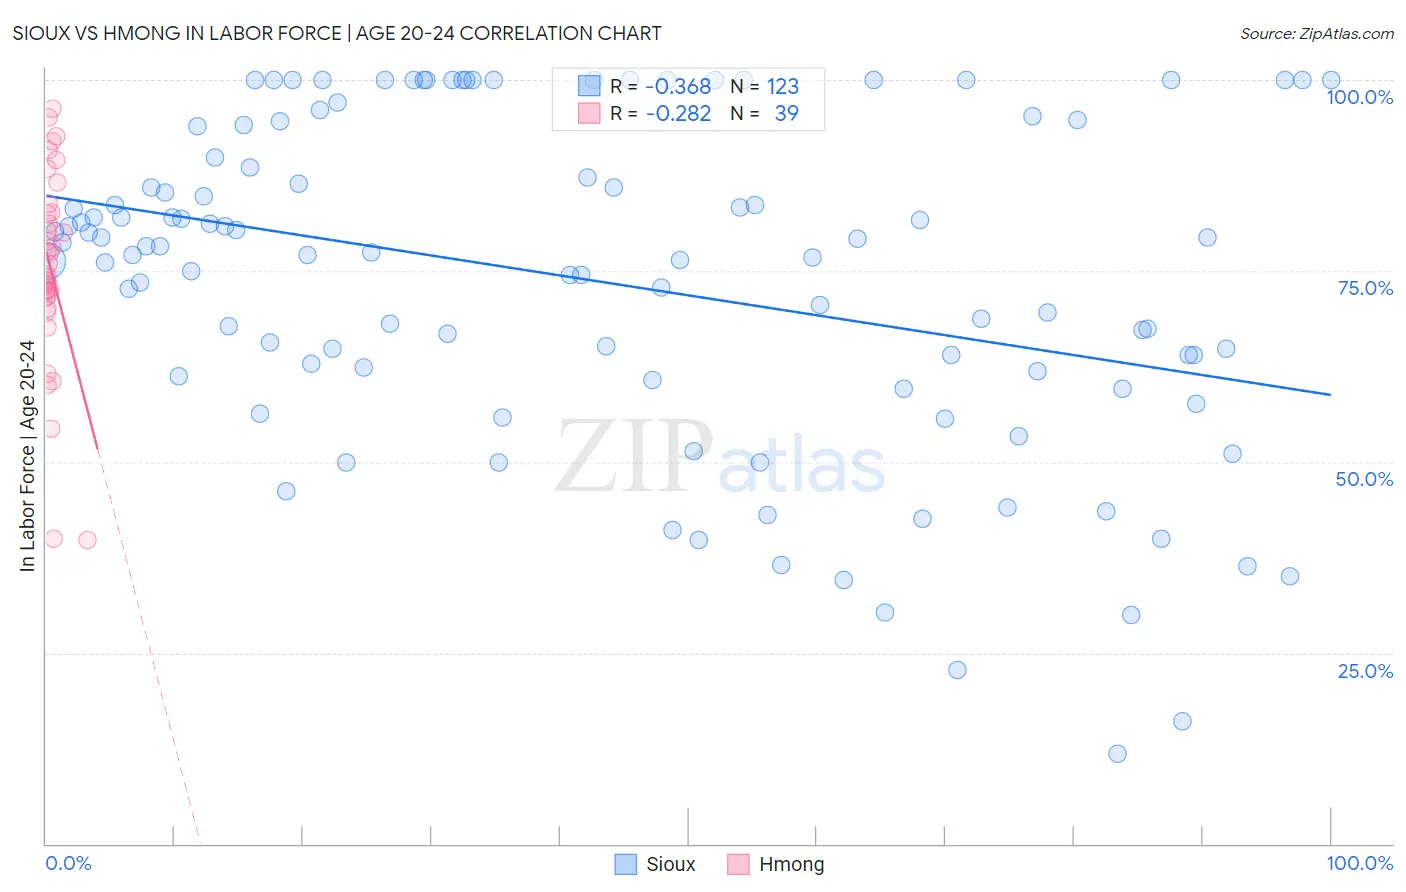
Sioux vs Hmong In Labor Force | Age 20-24 Correlation Chart
The statistical analysis conducted on geographies consisting of 234,099,226 people shows a mild negative correlation between the proportion of Sioux and labor force participation rate among population between the ages 20 and 24 in the United States with a correlation coefficient (R) of -0.368 and weighted average of 74.6%. Similarly, the statistical analysis conducted on geographies consisting of 24,681,034 people shows a weak negative correlation between the proportion of Hmong and labor force participation rate among population between the ages 20 and 24 in the United States with a correlation coefficient (R) of -0.282 and weighted average of 76.5%, a difference of 2.5%.
In Labor Force | Age 20-24 Correlation Summary
| Measurement | Sioux | Hmong |
| Minimum | 11.8% | 39.8% |
| Maximum | 100.0% | 96.2% |
| Range | 88.2% | 56.4% |
| Mean | 73.8% | 75.3% |
| Median | 77.4% | 74.5% |
| Interquartile 25% (IQ1) | 61.2% | 71.5% |
| Interquartile 75% (IQ3) | 93.9% | 82.7% |
| Interquartile Range (IQR) | 32.7% | 11.1% |
| Standard Deviation (Sample) | 21.4% | 12.8% |
| Standard Deviation (Population) | 21.3% | 12.6% |
Similar Demographics by In Labor Force | Age 20-24
Demographics Similar to Sioux by In Labor Force | Age 20-24
In terms of in labor force | age 20-24, the demographic groups most similar to Sioux are Immigrants from Italy (74.6%, a difference of 0.0%), Inupiat (74.6%, a difference of 0.0%), Immigrants from Northern Africa (74.6%, a difference of 0.010%), Albanian (74.6%, a difference of 0.030%), and Immigrants from Uruguay (74.6%, a difference of 0.040%).
| Demographics | Rating | Rank | In Labor Force | Age 20-24 |
| Taiwanese | 23.2 /100 | #199 | Fair 74.7% |
| Nigerians | 21.9 /100 | #200 | Fair 74.7% |
| Choctaw | 21.4 /100 | #201 | Fair 74.7% |
| Moroccans | 20.4 /100 | #202 | Fair 74.7% |
| Immigrants | Northern Africa | 17.9 /100 | #203 | Poor 74.6% |
| Immigrants | Italy | 17.6 /100 | #204 | Poor 74.6% |
| Inupiat | 17.6 /100 | #205 | Poor 74.6% |
| Sioux | 17.5 /100 | #206 | Poor 74.6% |
| Albanians | 16.2 /100 | #207 | Poor 74.6% |
| Immigrants | Uruguay | 15.8 /100 | #208 | Poor 74.6% |
| Arabs | 15.8 /100 | #209 | Poor 74.6% |
| Uruguayans | 15.1 /100 | #210 | Poor 74.6% |
| Immigrants | Australia | 14.7 /100 | #211 | Poor 74.6% |
| Creek | 13.3 /100 | #212 | Poor 74.5% |
| Peruvians | 13.3 /100 | #213 | Poor 74.5% |
Demographics Similar to Hmong by In Labor Force | Age 20-24
In terms of in labor force | age 20-24, the demographic groups most similar to Hmong are Basque (76.5%, a difference of 0.0%), Italian (76.5%, a difference of 0.020%), Immigrants from Zaire (76.6%, a difference of 0.040%), Canadian (76.6%, a difference of 0.060%), and Immigrants from Cameroon (76.6%, a difference of 0.070%).
| Demographics | Rating | Rank | In Labor Force | Age 20-24 |
| Immigrants | Middle Africa | 99.7 /100 | #75 | Exceptional 76.6% |
| Immigrants | Moldova | 99.6 /100 | #76 | Exceptional 76.6% |
| Immigrants | Cameroon | 99.6 /100 | #77 | Exceptional 76.6% |
| Canadians | 99.6 /100 | #78 | Exceptional 76.6% |
| Immigrants | Zaire | 99.6 /100 | #79 | Exceptional 76.6% |
| Italians | 99.6 /100 | #80 | Exceptional 76.5% |
| Basques | 99.5 /100 | #81 | Exceptional 76.5% |
| Hmong | 99.5 /100 | #82 | Exceptional 76.5% |
| Carpatho Rusyns | 99.4 /100 | #83 | Exceptional 76.5% |
| Austrians | 99.4 /100 | #84 | Exceptional 76.5% |
| Portuguese | 99.3 /100 | #85 | Exceptional 76.4% |
| Immigrants | Iraq | 99.3 /100 | #86 | Exceptional 76.4% |
| Immigrants | Thailand | 99.3 /100 | #87 | Exceptional 76.4% |
| Spanish | 99.2 /100 | #88 | Exceptional 76.4% |
| Bulgarians | 99.2 /100 | #89 | Exceptional 76.4% |