Sioux vs Immigrants from Philippines In Labor Force | Age 35-44
COMPARE
Sioux
Immigrants from Philippines
In Labor Force | Age 35-44
In Labor Force | Age 35-44 Comparison
Sioux
Immigrants from Philippines
80.2%
IN LABOR FORCE | AGE 35-44
0.0/ 100
METRIC RATING
327th/ 347
METRIC RANK
84.2%
IN LABOR FORCE | AGE 35-44
27.9/ 100
METRIC RATING
191st/ 347
METRIC RANK
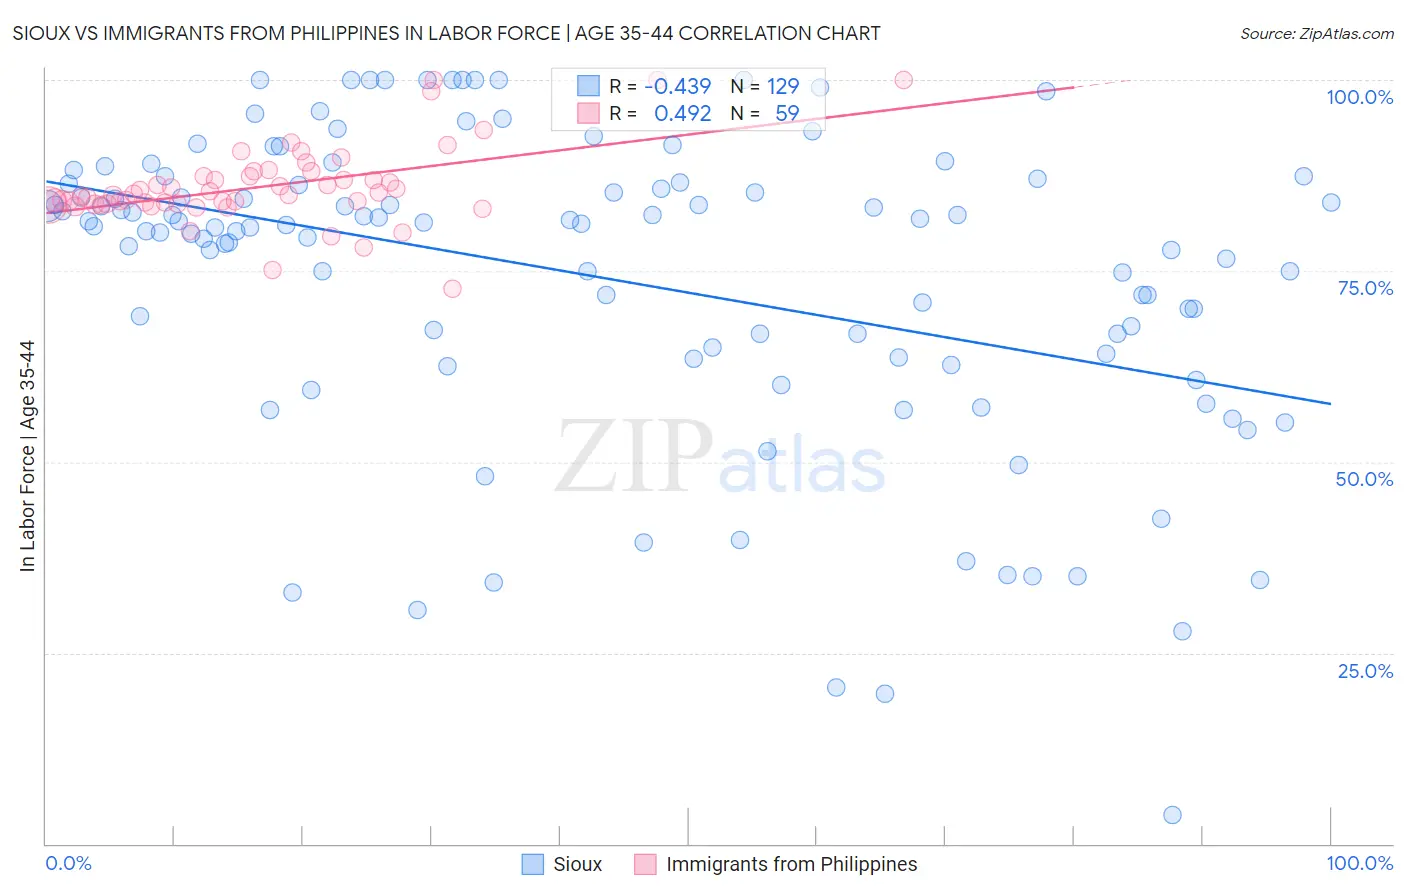
Sioux vs Immigrants from Philippines In Labor Force | Age 35-44 Correlation Chart
The statistical analysis conducted on geographies consisting of 234,125,659 people shows a moderate negative correlation between the proportion of Sioux and labor force participation rate among population between the ages 35 and 44 in the United States with a correlation coefficient (R) of -0.439 and weighted average of 80.2%. Similarly, the statistical analysis conducted on geographies consisting of 471,128,503 people shows a moderate positive correlation between the proportion of Immigrants from Philippines and labor force participation rate among population between the ages 35 and 44 in the United States with a correlation coefficient (R) of 0.492 and weighted average of 84.2%, a difference of 5.0%.
In Labor Force | Age 35-44 Correlation Summary
| Measurement | Sioux | Immigrants from Philippines |
| Minimum | 3.8% | 72.7% |
| Maximum | 100.0% | 100.0% |
| Range | 96.2% | 27.3% |
| Mean | 74.2% | 86.0% |
| Median | 80.8% | 85.0% |
| Interquartile 25% (IQ1) | 63.9% | 83.8% |
| Interquartile 75% (IQ3) | 86.5% | 87.4% |
| Interquartile Range (IQR) | 22.6% | 3.6% |
| Standard Deviation (Sample) | 20.1% | 5.1% |
| Standard Deviation (Population) | 20.0% | 5.1% |
Similar Demographics by In Labor Force | Age 35-44
Demographics Similar to Sioux by In Labor Force | Age 35-44
In terms of in labor force | age 35-44, the demographic groups most similar to Sioux are Seminole (80.4%, a difference of 0.17%), Dutch West Indian (80.4%, a difference of 0.21%), Creek (80.0%, a difference of 0.29%), Choctaw (80.5%, a difference of 0.36%), and Yaqui (80.5%, a difference of 0.37%).
| Demographics | Rating | Rank | In Labor Force | Age 35-44 |
| Chickasaw | 0.0 /100 | #320 | Tragic 80.9% |
| Puerto Ricans | 0.0 /100 | #321 | Tragic 80.7% |
| Paiute | 0.0 /100 | #322 | Tragic 80.6% |
| Yaqui | 0.0 /100 | #323 | Tragic 80.5% |
| Choctaw | 0.0 /100 | #324 | Tragic 80.5% |
| Dutch West Indians | 0.0 /100 | #325 | Tragic 80.4% |
| Seminole | 0.0 /100 | #326 | Tragic 80.4% |
| Sioux | 0.0 /100 | #327 | Tragic 80.2% |
| Creek | 0.0 /100 | #328 | Tragic 80.0% |
| Menominee | 0.0 /100 | #329 | Tragic 79.7% |
| Cheyenne | 0.0 /100 | #330 | Tragic 79.5% |
| Houma | 0.0 /100 | #331 | Tragic 79.5% |
| Ute | 0.0 /100 | #332 | Tragic 79.4% |
| Kiowa | 0.0 /100 | #333 | Tragic 79.2% |
| Yakama | 0.0 /100 | #334 | Tragic 79.0% |
Demographics Similar to Immigrants from Philippines by In Labor Force | Age 35-44
In terms of in labor force | age 35-44, the demographic groups most similar to Immigrants from Philippines are Immigrants from Vietnam (84.2%, a difference of 0.0%), Hungarian (84.2%, a difference of 0.010%), Immigrants from Indonesia (84.2%, a difference of 0.020%), Immigrants from Caribbean (84.2%, a difference of 0.020%), and Immigrants from England (84.2%, a difference of 0.020%).
| Demographics | Rating | Rank | In Labor Force | Age 35-44 |
| Armenians | 35.6 /100 | #184 | Fair 84.3% |
| Costa Ricans | 35.3 /100 | #185 | Fair 84.3% |
| Australians | 35.1 /100 | #186 | Fair 84.3% |
| Dutch | 34.8 /100 | #187 | Fair 84.3% |
| South Africans | 34.1 /100 | #188 | Fair 84.3% |
| Immigrants | Denmark | 33.7 /100 | #189 | Fair 84.3% |
| Portuguese | 31.9 /100 | #190 | Fair 84.3% |
| Immigrants | Philippines | 27.9 /100 | #191 | Fair 84.2% |
| Immigrants | Vietnam | 27.4 /100 | #192 | Fair 84.2% |
| Hungarians | 26.8 /100 | #193 | Fair 84.2% |
| Immigrants | Indonesia | 25.7 /100 | #194 | Fair 84.2% |
| Immigrants | Caribbean | 25.7 /100 | #195 | Fair 84.2% |
| Immigrants | England | 25.0 /100 | #196 | Fair 84.2% |
| Immigrants | Western Europe | 24.7 /100 | #197 | Fair 84.2% |
| Ecuadorians | 24.0 /100 | #198 | Fair 84.2% |