Sioux vs U.S. Virgin Islander In Labor Force | Age 20-24
COMPARE
Sioux
U.S. Virgin Islander
In Labor Force | Age 20-24
In Labor Force | Age 20-24 Comparison
Sioux
U.S. Virgin Islanders
74.6%
IN LABOR FORCE | AGE 20-24
17.5/ 100
METRIC RATING
206th/ 347
METRIC RANK
73.0%
IN LABOR FORCE | AGE 20-24
0.1/ 100
METRIC RATING
289th/ 347
METRIC RANK
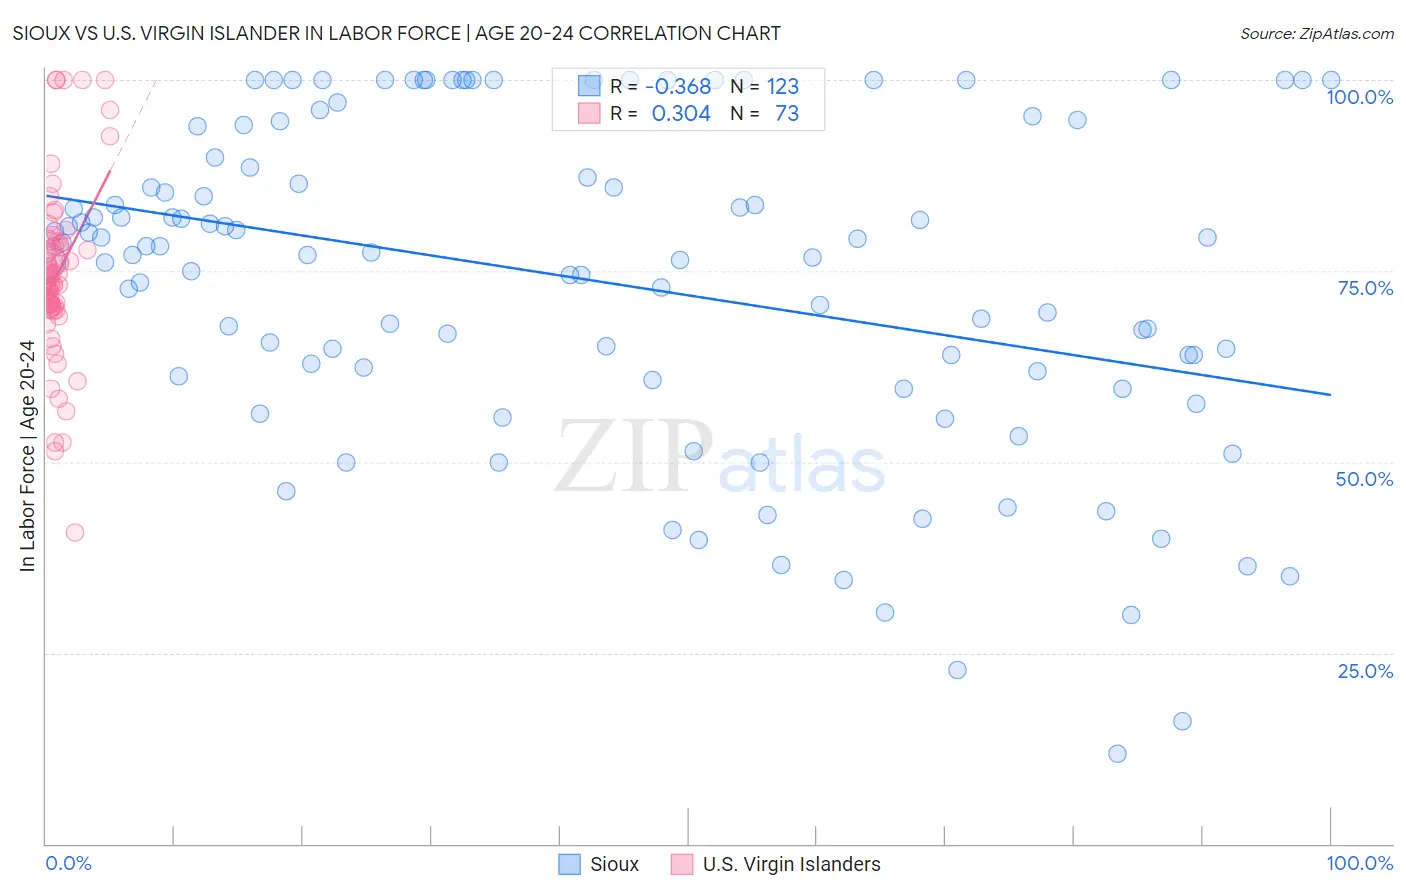
Sioux vs U.S. Virgin Islander In Labor Force | Age 20-24 Correlation Chart
The statistical analysis conducted on geographies consisting of 234,099,226 people shows a mild negative correlation between the proportion of Sioux and labor force participation rate among population between the ages 20 and 24 in the United States with a correlation coefficient (R) of -0.368 and weighted average of 74.6%. Similarly, the statistical analysis conducted on geographies consisting of 87,526,694 people shows a mild positive correlation between the proportion of U.S. Virgin Islanders and labor force participation rate among population between the ages 20 and 24 in the United States with a correlation coefficient (R) of 0.304 and weighted average of 73.0%, a difference of 2.2%.
In Labor Force | Age 20-24 Correlation Summary
| Measurement | Sioux | U.S. Virgin Islander |
| Minimum | 11.8% | 40.7% |
| Maximum | 100.0% | 100.0% |
| Range | 88.2% | 59.3% |
| Mean | 73.8% | 74.5% |
| Median | 77.4% | 73.8% |
| Interquartile 25% (IQ1) | 61.2% | 70.2% |
| Interquartile 75% (IQ3) | 93.9% | 78.7% |
| Interquartile Range (IQR) | 32.7% | 8.5% |
| Standard Deviation (Sample) | 21.4% | 11.3% |
| Standard Deviation (Population) | 21.3% | 11.2% |
Similar Demographics by In Labor Force | Age 20-24
Demographics Similar to Sioux by In Labor Force | Age 20-24
In terms of in labor force | age 20-24, the demographic groups most similar to Sioux are Immigrants from Italy (74.6%, a difference of 0.0%), Inupiat (74.6%, a difference of 0.0%), Immigrants from Northern Africa (74.6%, a difference of 0.010%), Albanian (74.6%, a difference of 0.030%), and Immigrants from Uruguay (74.6%, a difference of 0.040%).
| Demographics | Rating | Rank | In Labor Force | Age 20-24 |
| Taiwanese | 23.2 /100 | #199 | Fair 74.7% |
| Nigerians | 21.9 /100 | #200 | Fair 74.7% |
| Choctaw | 21.4 /100 | #201 | Fair 74.7% |
| Moroccans | 20.4 /100 | #202 | Fair 74.7% |
| Immigrants | Northern Africa | 17.9 /100 | #203 | Poor 74.6% |
| Immigrants | Italy | 17.6 /100 | #204 | Poor 74.6% |
| Inupiat | 17.6 /100 | #205 | Poor 74.6% |
| Sioux | 17.5 /100 | #206 | Poor 74.6% |
| Albanians | 16.2 /100 | #207 | Poor 74.6% |
| Immigrants | Uruguay | 15.8 /100 | #208 | Poor 74.6% |
| Arabs | 15.8 /100 | #209 | Poor 74.6% |
| Uruguayans | 15.1 /100 | #210 | Poor 74.6% |
| Immigrants | Australia | 14.7 /100 | #211 | Poor 74.6% |
| Creek | 13.3 /100 | #212 | Poor 74.5% |
| Peruvians | 13.3 /100 | #213 | Poor 74.5% |
Demographics Similar to U.S. Virgin Islanders by In Labor Force | Age 20-24
In terms of in labor force | age 20-24, the demographic groups most similar to U.S. Virgin Islanders are Argentinean (73.1%, a difference of 0.030%), Immigrants from Belarus (73.0%, a difference of 0.080%), Immigrants from Korea (73.1%, a difference of 0.11%), Immigrants from Lebanon (73.1%, a difference of 0.13%), and Immigrants from Nicaragua (72.9%, a difference of 0.15%).
| Demographics | Rating | Rank | In Labor Force | Age 20-24 |
| Immigrants | Spain | 0.1 /100 | #282 | Tragic 73.2% |
| Immigrants | Bahamas | 0.1 /100 | #283 | Tragic 73.2% |
| Kiowa | 0.1 /100 | #284 | Tragic 73.2% |
| Nicaraguans | 0.1 /100 | #285 | Tragic 73.2% |
| Immigrants | Lebanon | 0.1 /100 | #286 | Tragic 73.1% |
| Immigrants | Korea | 0.1 /100 | #287 | Tragic 73.1% |
| Argentineans | 0.1 /100 | #288 | Tragic 73.1% |
| U.S. Virgin Islanders | 0.1 /100 | #289 | Tragic 73.0% |
| Immigrants | Belarus | 0.1 /100 | #290 | Tragic 73.0% |
| Immigrants | Nicaragua | 0.0 /100 | #291 | Tragic 72.9% |
| Pueblo | 0.0 /100 | #292 | Tragic 72.9% |
| Immigrants | Belize | 0.0 /100 | #293 | Tragic 72.8% |
| Immigrants | Argentina | 0.0 /100 | #294 | Tragic 72.8% |
| Okinawans | 0.0 /100 | #295 | Tragic 72.7% |
| Jamaicans | 0.0 /100 | #296 | Tragic 72.7% |