Sioux vs Bulgarian In Labor Force | Age 45-54
COMPARE
Sioux
Bulgarian
In Labor Force | Age 45-54
In Labor Force | Age 45-54 Comparison
Sioux
Bulgarians
78.0%
IN LABOR FORCE | AGE 45-54
0.0/ 100
METRIC RATING
328th/ 347
METRIC RANK
84.2%
IN LABOR FORCE | AGE 45-54
100.0/ 100
METRIC RATING
12th/ 347
METRIC RANK
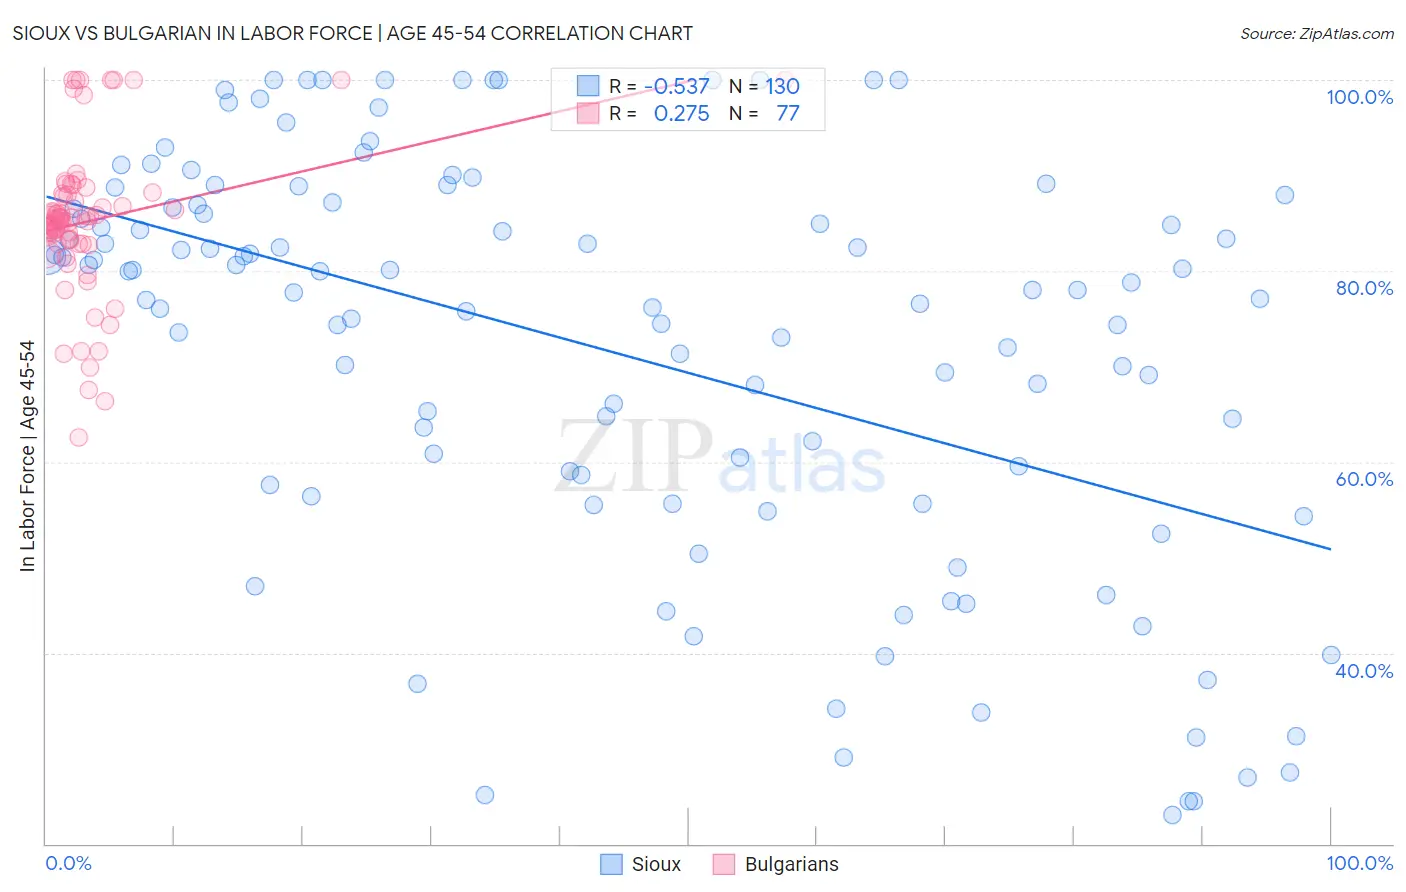
Sioux vs Bulgarian In Labor Force | Age 45-54 Correlation Chart
The statistical analysis conducted on geographies consisting of 234,094,321 people shows a substantial negative correlation between the proportion of Sioux and labor force participation rate among population between the ages 45 and 54 in the United States with a correlation coefficient (R) of -0.537 and weighted average of 78.0%. Similarly, the statistical analysis conducted on geographies consisting of 205,560,159 people shows a weak positive correlation between the proportion of Bulgarians and labor force participation rate among population between the ages 45 and 54 in the United States with a correlation coefficient (R) of 0.275 and weighted average of 84.2%, a difference of 8.1%.
In Labor Force | Age 45-54 Correlation Summary
| Measurement | Sioux | Bulgarian |
| Minimum | 23.0% | 62.5% |
| Maximum | 100.0% | 100.0% |
| Range | 77.0% | 37.5% |
| Mean | 71.7% | 85.2% |
| Median | 77.9% | 85.5% |
| Interquartile 25% (IQ1) | 57.6% | 82.8% |
| Interquartile 75% (IQ3) | 86.6% | 88.1% |
| Interquartile Range (IQR) | 29.0% | 5.2% |
| Standard Deviation (Sample) | 21.0% | 7.9% |
| Standard Deviation (Population) | 21.0% | 7.9% |
Similar Demographics by In Labor Force | Age 45-54
Demographics Similar to Sioux by In Labor Force | Age 45-54
In terms of in labor force | age 45-54, the demographic groups most similar to Sioux are Cajun (78.1%, a difference of 0.22%), Seminole (78.1%, a difference of 0.23%), Choctaw (78.2%, a difference of 0.28%), Creek (77.7%, a difference of 0.29%), and Dutch West Indian (78.2%, a difference of 0.37%).
| Demographics | Rating | Rank | In Labor Force | Age 45-54 |
| Yup'ik | 0.0 /100 | #321 | Tragic 78.6% |
| Crow | 0.0 /100 | #322 | Tragic 78.3% |
| Kiowa | 0.0 /100 | #323 | Tragic 78.3% |
| Dutch West Indians | 0.0 /100 | #324 | Tragic 78.2% |
| Choctaw | 0.0 /100 | #325 | Tragic 78.2% |
| Seminole | 0.0 /100 | #326 | Tragic 78.1% |
| Cajuns | 0.0 /100 | #327 | Tragic 78.1% |
| Sioux | 0.0 /100 | #328 | Tragic 78.0% |
| Creek | 0.0 /100 | #329 | Tragic 77.7% |
| Cheyenne | 0.0 /100 | #330 | Tragic 77.6% |
| Tsimshian | 0.0 /100 | #331 | Tragic 77.4% |
| Menominee | 0.0 /100 | #332 | Tragic 77.4% |
| Natives/Alaskans | 0.0 /100 | #333 | Tragic 77.1% |
| Apache | 0.0 /100 | #334 | Tragic 77.1% |
| Arapaho | 0.0 /100 | #335 | Tragic 77.1% |
Demographics Similar to Bulgarians by In Labor Force | Age 45-54
In terms of in labor force | age 45-54, the demographic groups most similar to Bulgarians are Thai (84.3%, a difference of 0.11%), Chinese (84.1%, a difference of 0.11%), Cambodian (84.1%, a difference of 0.14%), Norwegian (84.4%, a difference of 0.20%), and Cypriot (84.1%, a difference of 0.20%).
| Demographics | Rating | Rank | In Labor Force | Age 45-54 |
| Ethiopians | 100.0 /100 | #5 | Exceptional 84.8% |
| Immigrants | India | 100.0 /100 | #6 | Exceptional 84.7% |
| Immigrants | Cameroon | 100.0 /100 | #7 | Exceptional 84.6% |
| Sierra Leoneans | 100.0 /100 | #8 | Exceptional 84.5% |
| Immigrants | Sierra Leone | 100.0 /100 | #9 | Exceptional 84.4% |
| Norwegians | 100.0 /100 | #10 | Exceptional 84.4% |
| Thais | 100.0 /100 | #11 | Exceptional 84.3% |
| Bulgarians | 100.0 /100 | #12 | Exceptional 84.2% |
| Chinese | 99.9 /100 | #13 | Exceptional 84.1% |
| Cambodians | 99.9 /100 | #14 | Exceptional 84.1% |
| Cypriots | 99.9 /100 | #15 | Exceptional 84.1% |
| Immigrants | Nepal | 99.9 /100 | #16 | Exceptional 84.0% |
| Zimbabweans | 99.9 /100 | #17 | Exceptional 84.0% |
| Immigrants | South Central Asia | 99.9 /100 | #18 | Exceptional 84.0% |
| Czechs | 99.8 /100 | #19 | Exceptional 83.9% |