Sioux vs Venezuelan In Labor Force | Age 45-54
COMPARE
Sioux
Venezuelan
In Labor Force | Age 45-54
In Labor Force | Age 45-54 Comparison
Sioux
Venezuelans
78.0%
IN LABOR FORCE | AGE 45-54
0.0/ 100
METRIC RATING
328th/ 347
METRIC RANK
83.6%
IN LABOR FORCE | AGE 45-54
99.2/ 100
METRIC RATING
43rd/ 347
METRIC RANK
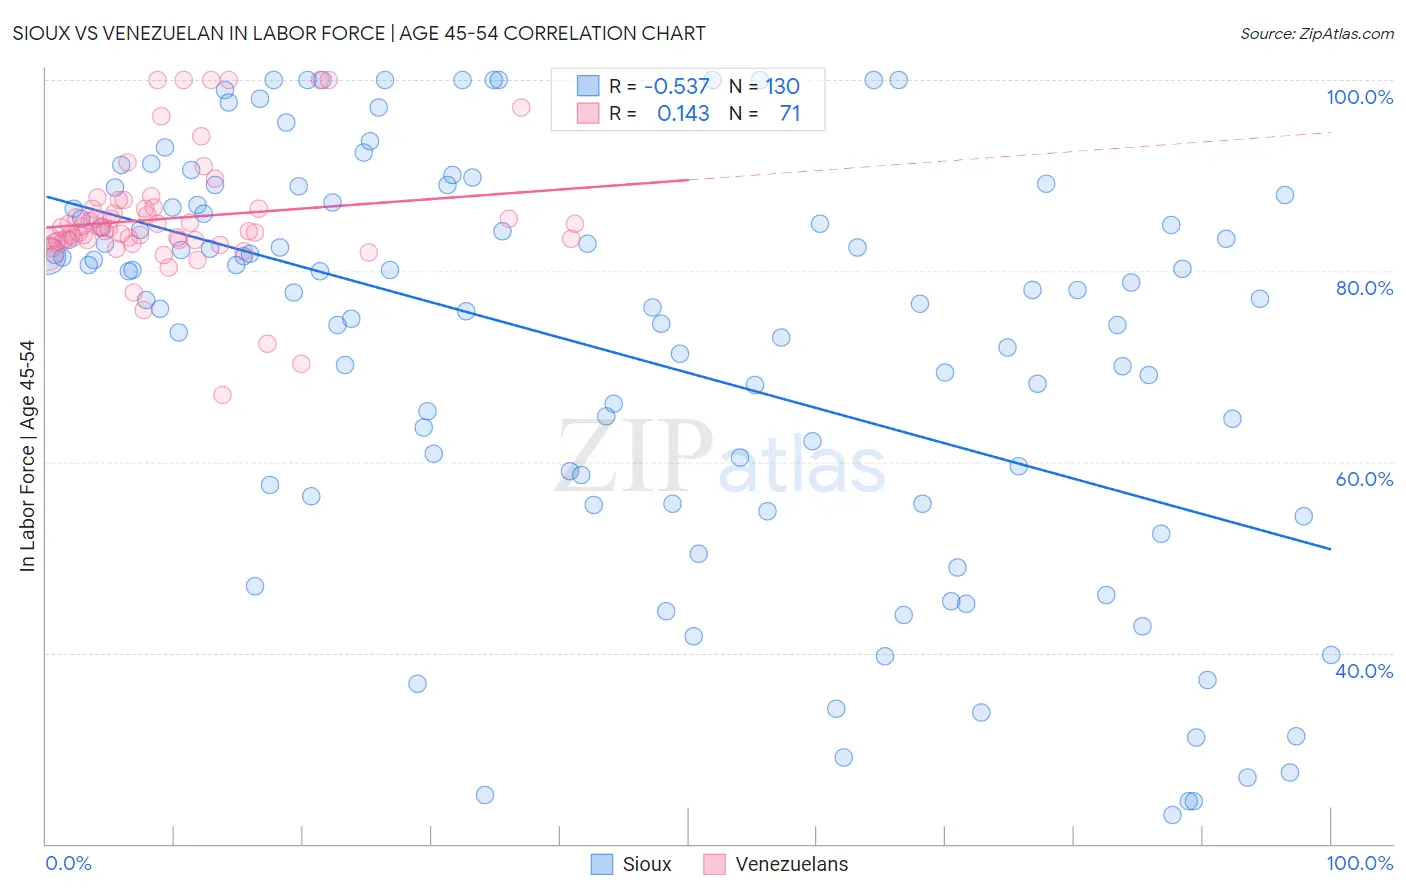
Sioux vs Venezuelan In Labor Force | Age 45-54 Correlation Chart
The statistical analysis conducted on geographies consisting of 234,094,321 people shows a substantial negative correlation between the proportion of Sioux and labor force participation rate among population between the ages 45 and 54 in the United States with a correlation coefficient (R) of -0.537 and weighted average of 78.0%. Similarly, the statistical analysis conducted on geographies consisting of 306,136,855 people shows a poor positive correlation between the proportion of Venezuelans and labor force participation rate among population between the ages 45 and 54 in the United States with a correlation coefficient (R) of 0.143 and weighted average of 83.6%, a difference of 7.3%.
In Labor Force | Age 45-54 Correlation Summary
| Measurement | Sioux | Venezuelan |
| Minimum | 23.0% | 67.0% |
| Maximum | 100.0% | 100.0% |
| Range | 77.0% | 33.0% |
| Mean | 71.7% | 85.5% |
| Median | 77.9% | 84.4% |
| Interquartile 25% (IQ1) | 57.6% | 83.2% |
| Interquartile 75% (IQ3) | 86.6% | 86.5% |
| Interquartile Range (IQR) | 29.0% | 3.3% |
| Standard Deviation (Sample) | 21.0% | 6.3% |
| Standard Deviation (Population) | 21.0% | 6.3% |
Similar Demographics by In Labor Force | Age 45-54
Demographics Similar to Sioux by In Labor Force | Age 45-54
In terms of in labor force | age 45-54, the demographic groups most similar to Sioux are Cajun (78.1%, a difference of 0.22%), Seminole (78.1%, a difference of 0.23%), Choctaw (78.2%, a difference of 0.28%), Creek (77.7%, a difference of 0.29%), and Dutch West Indian (78.2%, a difference of 0.37%).
| Demographics | Rating | Rank | In Labor Force | Age 45-54 |
| Yup'ik | 0.0 /100 | #321 | Tragic 78.6% |
| Crow | 0.0 /100 | #322 | Tragic 78.3% |
| Kiowa | 0.0 /100 | #323 | Tragic 78.3% |
| Dutch West Indians | 0.0 /100 | #324 | Tragic 78.2% |
| Choctaw | 0.0 /100 | #325 | Tragic 78.2% |
| Seminole | 0.0 /100 | #326 | Tragic 78.1% |
| Cajuns | 0.0 /100 | #327 | Tragic 78.1% |
| Sioux | 0.0 /100 | #328 | Tragic 78.0% |
| Creek | 0.0 /100 | #329 | Tragic 77.7% |
| Cheyenne | 0.0 /100 | #330 | Tragic 77.6% |
| Tsimshian | 0.0 /100 | #331 | Tragic 77.4% |
| Menominee | 0.0 /100 | #332 | Tragic 77.4% |
| Natives/Alaskans | 0.0 /100 | #333 | Tragic 77.1% |
| Apache | 0.0 /100 | #334 | Tragic 77.1% |
| Arapaho | 0.0 /100 | #335 | Tragic 77.1% |
Demographics Similar to Venezuelans by In Labor Force | Age 45-54
In terms of in labor force | age 45-54, the demographic groups most similar to Venezuelans are Burmese (83.6%, a difference of 0.020%), Immigrants from Hong Kong (83.6%, a difference of 0.020%), Lithuanian (83.6%, a difference of 0.030%), Croatian (83.6%, a difference of 0.040%), and Immigrants from Uganda (83.7%, a difference of 0.050%).
| Demographics | Rating | Rank | In Labor Force | Age 45-54 |
| Ugandans | 99.5 /100 | #36 | Exceptional 83.7% |
| Swedes | 99.4 /100 | #37 | Exceptional 83.7% |
| Immigrants | Venezuela | 99.4 /100 | #38 | Exceptional 83.7% |
| Immigrants | Cuba | 99.4 /100 | #39 | Exceptional 83.7% |
| Immigrants | Uganda | 99.4 /100 | #40 | Exceptional 83.7% |
| Immigrants | Korea | 99.3 /100 | #41 | Exceptional 83.7% |
| Immigrants | Moldova | 99.3 /100 | #42 | Exceptional 83.7% |
| Venezuelans | 99.2 /100 | #43 | Exceptional 83.6% |
| Burmese | 99.1 /100 | #44 | Exceptional 83.6% |
| Immigrants | Hong Kong | 99.1 /100 | #45 | Exceptional 83.6% |
| Lithuanians | 99.1 /100 | #46 | Exceptional 83.6% |
| Croatians | 99.0 /100 | #47 | Exceptional 83.6% |
| Immigrants | Poland | 99.0 /100 | #48 | Exceptional 83.6% |
| Immigrants | Morocco | 99.0 /100 | #49 | Exceptional 83.6% |
| Immigrants | Greece | 98.8 /100 | #50 | Exceptional 83.6% |