Sierra Leonean vs English In Labor Force | Age 16-19
COMPARE
Sierra Leonean
English
In Labor Force | Age 16-19
In Labor Force | Age 16-19 Comparison
Sierra Leoneans
English
37.6%
IN LABOR FORCE | AGE 16-19
89.7/ 100
METRIC RATING
142nd/ 347
METRIC RANK
42.4%
IN LABOR FORCE | AGE 16-19
100.0/ 100
METRIC RATING
26th/ 347
METRIC RANK
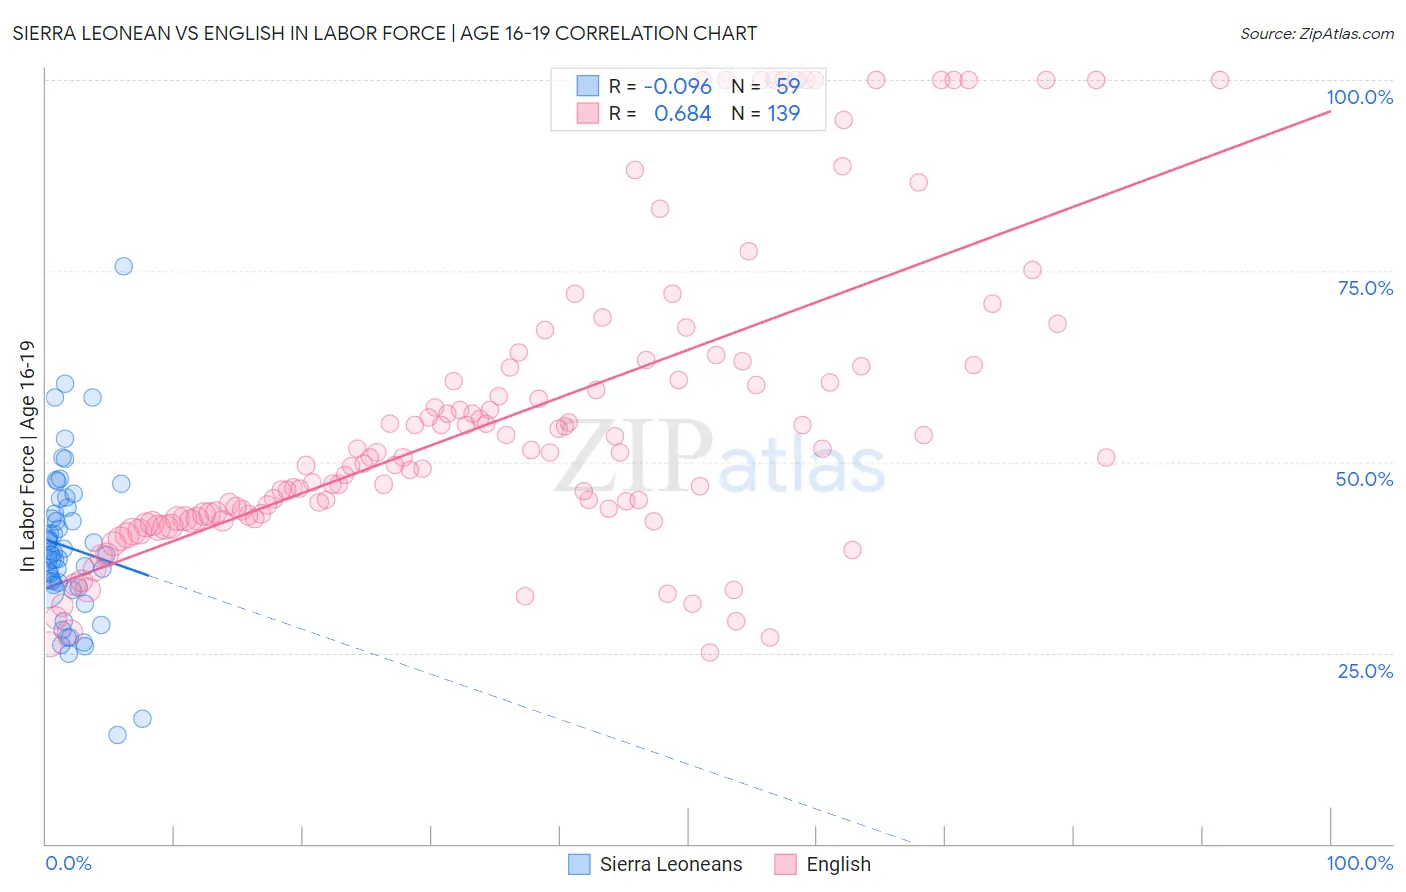
Sierra Leonean vs English In Labor Force | Age 16-19 Correlation Chart
The statistical analysis conducted on geographies consisting of 83,336,332 people shows a slight negative correlation between the proportion of Sierra Leoneans and labor force participation rate among population between the ages 16 and 19 in the United States with a correlation coefficient (R) of -0.096 and weighted average of 37.6%. Similarly, the statistical analysis conducted on geographies consisting of 574,065,457 people shows a significant positive correlation between the proportion of English and labor force participation rate among population between the ages 16 and 19 in the United States with a correlation coefficient (R) of 0.684 and weighted average of 42.4%, a difference of 12.8%.
In Labor Force | Age 16-19 Correlation Summary
| Measurement | Sierra Leonean | English |
| Minimum | 14.3% | 25.0% |
| Maximum | 75.6% | 100.0% |
| Range | 61.3% | 75.0% |
| Mean | 38.8% | 55.8% |
| Median | 37.8% | 50.5% |
| Interquartile 25% (IQ1) | 33.5% | 42.6% |
| Interquartile 75% (IQ3) | 44.1% | 62.5% |
| Interquartile Range (IQR) | 10.6% | 19.9% |
| Standard Deviation (Sample) | 10.4% | 19.9% |
| Standard Deviation (Population) | 10.3% | 19.8% |
Similar Demographics by In Labor Force | Age 16-19
Demographics Similar to Sierra Leoneans by In Labor Force | Age 16-19
In terms of in labor force | age 16-19, the demographic groups most similar to Sierra Leoneans are Pakistani (37.6%, a difference of 0.030%), Japanese (37.5%, a difference of 0.050%), Paiute (37.5%, a difference of 0.050%), Immigrants from Western Europe (37.5%, a difference of 0.10%), and Brazilian (37.5%, a difference of 0.13%).
| Demographics | Rating | Rank | In Labor Force | Age 16-19 |
| Macedonians | 93.4 /100 | #135 | Exceptional 37.8% |
| Australians | 93.2 /100 | #136 | Exceptional 37.8% |
| Cajuns | 93.2 /100 | #137 | Exceptional 37.8% |
| Comanche | 91.9 /100 | #138 | Exceptional 37.7% |
| Immigrants | Moldova | 91.9 /100 | #139 | Exceptional 37.7% |
| Estonians | 91.7 /100 | #140 | Exceptional 37.7% |
| Syrians | 90.7 /100 | #141 | Exceptional 37.6% |
| Sierra Leoneans | 89.7 /100 | #142 | Excellent 37.6% |
| Pakistanis | 89.5 /100 | #143 | Excellent 37.6% |
| Japanese | 89.3 /100 | #144 | Excellent 37.5% |
| Paiute | 89.3 /100 | #145 | Excellent 37.5% |
| Immigrants | Western Europe | 88.9 /100 | #146 | Excellent 37.5% |
| Brazilians | 88.7 /100 | #147 | Excellent 37.5% |
| Romanians | 87.3 /100 | #148 | Excellent 37.5% |
| Native Hawaiians | 85.0 /100 | #149 | Excellent 37.4% |
Demographics Similar to English by In Labor Force | Age 16-19
In terms of in labor force | age 16-19, the demographic groups most similar to English are German Russian (42.4%, a difference of 0.13%), Bangladeshi (42.5%, a difference of 0.21%), Welsh (42.3%, a difference of 0.28%), Slovak (42.6%, a difference of 0.54%), and Polish (42.1%, a difference of 0.57%).
| Demographics | Rating | Rank | In Labor Force | Age 16-19 |
| Belgians | 100.0 /100 | #19 | Exceptional 43.4% |
| Swiss | 100.0 /100 | #20 | Exceptional 43.3% |
| Ottawa | 100.0 /100 | #21 | Exceptional 43.0% |
| Sudanese | 100.0 /100 | #22 | Exceptional 42.9% |
| Slovaks | 100.0 /100 | #23 | Exceptional 42.6% |
| Bangladeshis | 100.0 /100 | #24 | Exceptional 42.5% |
| German Russians | 100.0 /100 | #25 | Exceptional 42.4% |
| English | 100.0 /100 | #26 | Exceptional 42.4% |
| Welsh | 100.0 /100 | #27 | Exceptional 42.3% |
| Poles | 100.0 /100 | #28 | Exceptional 42.1% |
| French | 100.0 /100 | #29 | Exceptional 42.1% |
| Scottish | 100.0 /100 | #30 | Exceptional 42.0% |
| Irish | 100.0 /100 | #31 | Exceptional 42.0% |
| Czechoslovakians | 100.0 /100 | #32 | Exceptional 41.9% |
| Liberians | 100.0 /100 | #33 | Exceptional 41.8% |