Sierra Leonean vs Colville In Labor Force | Age 16-19
COMPARE
Sierra Leonean
Colville
In Labor Force | Age 16-19
In Labor Force | Age 16-19 Comparison
Sierra Leoneans
Colville
37.6%
IN LABOR FORCE | AGE 16-19
89.7/ 100
METRIC RATING
142nd/ 347
METRIC RANK
38.3%
IN LABOR FORCE | AGE 16-19
97.9/ 100
METRIC RATING
116th/ 347
METRIC RANK
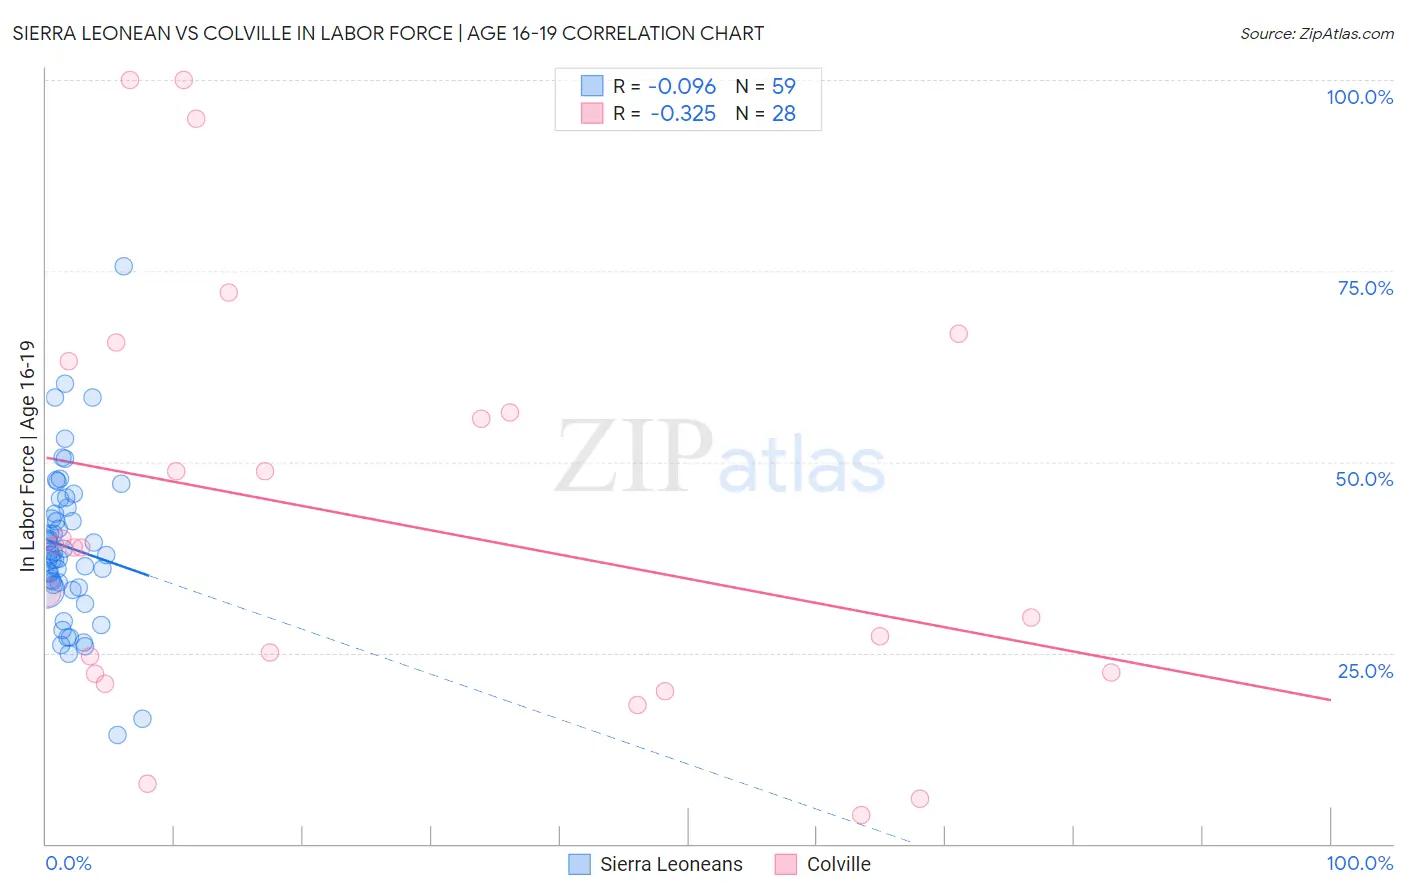
Sierra Leonean vs Colville In Labor Force | Age 16-19 Correlation Chart
The statistical analysis conducted on geographies consisting of 83,336,332 people shows a slight negative correlation between the proportion of Sierra Leoneans and labor force participation rate among population between the ages 16 and 19 in the United States with a correlation coefficient (R) of -0.096 and weighted average of 37.6%. Similarly, the statistical analysis conducted on geographies consisting of 34,676,086 people shows a mild negative correlation between the proportion of Colville and labor force participation rate among population between the ages 16 and 19 in the United States with a correlation coefficient (R) of -0.325 and weighted average of 38.3%, a difference of 2.1%.
In Labor Force | Age 16-19 Correlation Summary
| Measurement | Sierra Leonean | Colville |
| Minimum | 14.3% | 3.7% |
| Maximum | 75.6% | 100.0% |
| Range | 61.3% | 96.3% |
| Mean | 38.8% | 42.5% |
| Median | 37.8% | 38.8% |
| Interquartile 25% (IQ1) | 33.5% | 22.4% |
| Interquartile 75% (IQ3) | 44.1% | 59.8% |
| Interquartile Range (IQR) | 10.6% | 37.4% |
| Standard Deviation (Sample) | 10.4% | 27.1% |
| Standard Deviation (Population) | 10.3% | 26.6% |
Similar Demographics by In Labor Force | Age 16-19
Demographics Similar to Sierra Leoneans by In Labor Force | Age 16-19
In terms of in labor force | age 16-19, the demographic groups most similar to Sierra Leoneans are Pakistani (37.6%, a difference of 0.030%), Japanese (37.5%, a difference of 0.050%), Paiute (37.5%, a difference of 0.050%), Immigrants from Western Europe (37.5%, a difference of 0.10%), and Brazilian (37.5%, a difference of 0.13%).
| Demographics | Rating | Rank | In Labor Force | Age 16-19 |
| Macedonians | 93.4 /100 | #135 | Exceptional 37.8% |
| Australians | 93.2 /100 | #136 | Exceptional 37.8% |
| Cajuns | 93.2 /100 | #137 | Exceptional 37.8% |
| Comanche | 91.9 /100 | #138 | Exceptional 37.7% |
| Immigrants | Moldova | 91.9 /100 | #139 | Exceptional 37.7% |
| Estonians | 91.7 /100 | #140 | Exceptional 37.7% |
| Syrians | 90.7 /100 | #141 | Exceptional 37.6% |
| Sierra Leoneans | 89.7 /100 | #142 | Excellent 37.6% |
| Pakistanis | 89.5 /100 | #143 | Excellent 37.6% |
| Japanese | 89.3 /100 | #144 | Excellent 37.5% |
| Paiute | 89.3 /100 | #145 | Excellent 37.5% |
| Immigrants | Western Europe | 88.9 /100 | #146 | Excellent 37.5% |
| Brazilians | 88.7 /100 | #147 | Excellent 37.5% |
| Romanians | 87.3 /100 | #148 | Excellent 37.5% |
| Native Hawaiians | 85.0 /100 | #149 | Excellent 37.4% |
Demographics Similar to Colville by In Labor Force | Age 16-19
In terms of in labor force | age 16-19, the demographic groups most similar to Colville are Bulgarian (38.3%, a difference of 0.010%), Chickasaw (38.3%, a difference of 0.050%), Immigrants from Nepal (38.3%, a difference of 0.060%), Assyrian/Chaldean/Syriac (38.3%, a difference of 0.080%), and Hawaiian (38.4%, a difference of 0.15%).
| Demographics | Rating | Rank | In Labor Force | Age 16-19 |
| Lebanese | 98.7 /100 | #109 | Exceptional 38.6% |
| Maltese | 98.6 /100 | #110 | Exceptional 38.5% |
| Crow | 98.5 /100 | #111 | Exceptional 38.5% |
| Immigrants | Scotland | 98.5 /100 | #112 | Exceptional 38.5% |
| Sub-Saharan Africans | 98.3 /100 | #113 | Exceptional 38.4% |
| Hawaiians | 98.2 /100 | #114 | Exceptional 38.4% |
| Bulgarians | 97.9 /100 | #115 | Exceptional 38.3% |
| Colville | 97.9 /100 | #116 | Exceptional 38.3% |
| Chickasaw | 97.8 /100 | #117 | Exceptional 38.3% |
| Immigrants | Nepal | 97.8 /100 | #118 | Exceptional 38.3% |
| Assyrians/Chaldeans/Syriacs | 97.8 /100 | #119 | Exceptional 38.3% |
| Ukrainians | 97.6 /100 | #120 | Exceptional 38.3% |
| Ethiopians | 97.4 /100 | #121 | Exceptional 38.2% |
| Guamanians/Chamorros | 97.4 /100 | #122 | Exceptional 38.2% |
| Seminole | 96.7 /100 | #123 | Exceptional 38.1% |