Iranian vs English In Labor Force | Age 16-19
COMPARE
Iranian
English
In Labor Force | Age 16-19
In Labor Force | Age 16-19 Comparison
Iranians
English
33.0%
IN LABOR FORCE | AGE 16-19
0.0/ 100
METRIC RATING
298th/ 347
METRIC RANK
42.4%
IN LABOR FORCE | AGE 16-19
100.0/ 100
METRIC RATING
26th/ 347
METRIC RANK
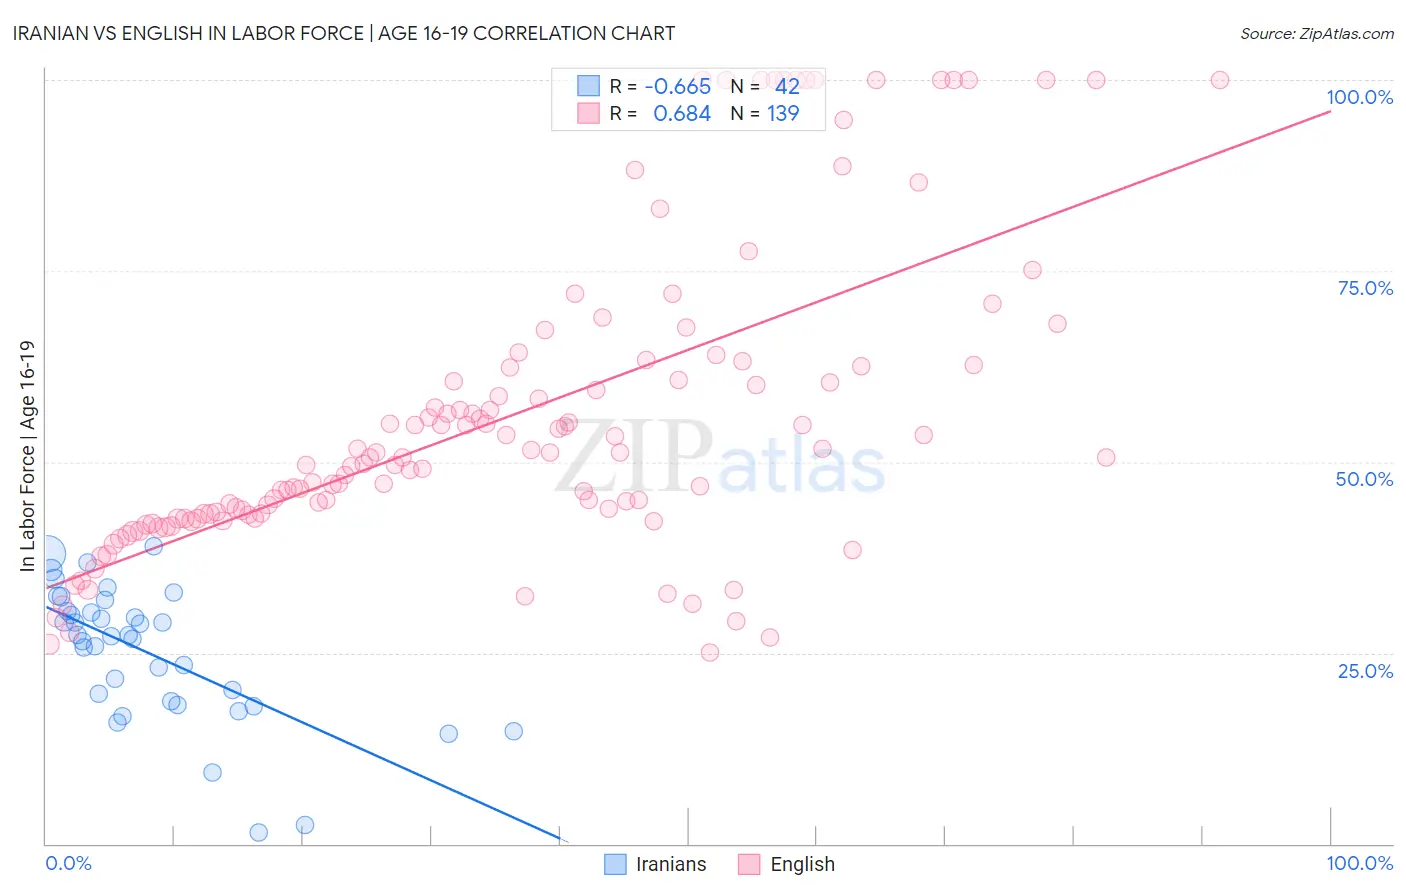
Iranian vs English In Labor Force | Age 16-19 Correlation Chart
The statistical analysis conducted on geographies consisting of 316,490,712 people shows a significant negative correlation between the proportion of Iranians and labor force participation rate among population between the ages 16 and 19 in the United States with a correlation coefficient (R) of -0.665 and weighted average of 33.0%. Similarly, the statistical analysis conducted on geographies consisting of 574,065,457 people shows a significant positive correlation between the proportion of English and labor force participation rate among population between the ages 16 and 19 in the United States with a correlation coefficient (R) of 0.684 and weighted average of 42.4%, a difference of 28.3%.
In Labor Force | Age 16-19 Correlation Summary
| Measurement | Iranian | English |
| Minimum | 1.4% | 25.0% |
| Maximum | 39.0% | 100.0% |
| Range | 37.6% | 75.0% |
| Mean | 25.1% | 55.8% |
| Median | 27.2% | 50.5% |
| Interquartile 25% (IQ1) | 18.6% | 42.6% |
| Interquartile 75% (IQ3) | 30.5% | 62.5% |
| Interquartile Range (IQR) | 11.9% | 19.9% |
| Standard Deviation (Sample) | 8.8% | 19.9% |
| Standard Deviation (Population) | 8.7% | 19.8% |
Similar Demographics by In Labor Force | Age 16-19
Demographics Similar to Iranians by In Labor Force | Age 16-19
In terms of in labor force | age 16-19, the demographic groups most similar to Iranians are Armenian (32.9%, a difference of 0.24%), Immigrants from Argentina (32.9%, a difference of 0.40%), Immigrants from Haiti (33.2%, a difference of 0.51%), Jamaican (33.2%, a difference of 0.60%), and Okinawan (32.8%, a difference of 0.63%).
| Demographics | Rating | Rank | In Labor Force | Age 16-19 |
| Immigrants | Belarus | 0.1 /100 | #291 | Tragic 33.4% |
| Haitians | 0.1 /100 | #292 | Tragic 33.4% |
| Immigrants | South America | 0.1 /100 | #293 | Tragic 33.3% |
| Argentineans | 0.1 /100 | #294 | Tragic 33.3% |
| Yup'ik | 0.1 /100 | #295 | Tragic 33.3% |
| Jamaicans | 0.1 /100 | #296 | Tragic 33.2% |
| Immigrants | Haiti | 0.1 /100 | #297 | Tragic 33.2% |
| Iranians | 0.0 /100 | #298 | Tragic 33.0% |
| Armenians | 0.0 /100 | #299 | Tragic 32.9% |
| Immigrants | Argentina | 0.0 /100 | #300 | Tragic 32.9% |
| Okinawans | 0.0 /100 | #301 | Tragic 32.8% |
| Belizeans | 0.0 /100 | #302 | Tragic 32.8% |
| Immigrants | Dominica | 0.0 /100 | #303 | Tragic 32.5% |
| Israelis | 0.0 /100 | #304 | Tragic 32.4% |
| Nicaraguans | 0.0 /100 | #305 | Tragic 32.4% |
Demographics Similar to English by In Labor Force | Age 16-19
In terms of in labor force | age 16-19, the demographic groups most similar to English are German Russian (42.4%, a difference of 0.13%), Bangladeshi (42.5%, a difference of 0.21%), Welsh (42.3%, a difference of 0.28%), Slovak (42.6%, a difference of 0.54%), and Polish (42.1%, a difference of 0.57%).
| Demographics | Rating | Rank | In Labor Force | Age 16-19 |
| Belgians | 100.0 /100 | #19 | Exceptional 43.4% |
| Swiss | 100.0 /100 | #20 | Exceptional 43.3% |
| Ottawa | 100.0 /100 | #21 | Exceptional 43.0% |
| Sudanese | 100.0 /100 | #22 | Exceptional 42.9% |
| Slovaks | 100.0 /100 | #23 | Exceptional 42.6% |
| Bangladeshis | 100.0 /100 | #24 | Exceptional 42.5% |
| German Russians | 100.0 /100 | #25 | Exceptional 42.4% |
| English | 100.0 /100 | #26 | Exceptional 42.4% |
| Welsh | 100.0 /100 | #27 | Exceptional 42.3% |
| Poles | 100.0 /100 | #28 | Exceptional 42.1% |
| French | 100.0 /100 | #29 | Exceptional 42.1% |
| Scottish | 100.0 /100 | #30 | Exceptional 42.0% |
| Irish | 100.0 /100 | #31 | Exceptional 42.0% |
| Czechoslovakians | 100.0 /100 | #32 | Exceptional 41.9% |
| Liberians | 100.0 /100 | #33 | Exceptional 41.8% |