Sierra Leonean vs Immigrants from Zimbabwe In Labor Force | Age 16-19
COMPARE
Sierra Leonean
Immigrants from Zimbabwe
In Labor Force | Age 16-19
In Labor Force | Age 16-19 Comparison
Sierra Leoneans
Immigrants from Zimbabwe
37.6%
IN LABOR FORCE | AGE 16-19
89.7/ 100
METRIC RATING
142nd/ 347
METRIC RANK
38.0%
IN LABOR FORCE | AGE 16-19
95.4/ 100
METRIC RATING
130th/ 347
METRIC RANK
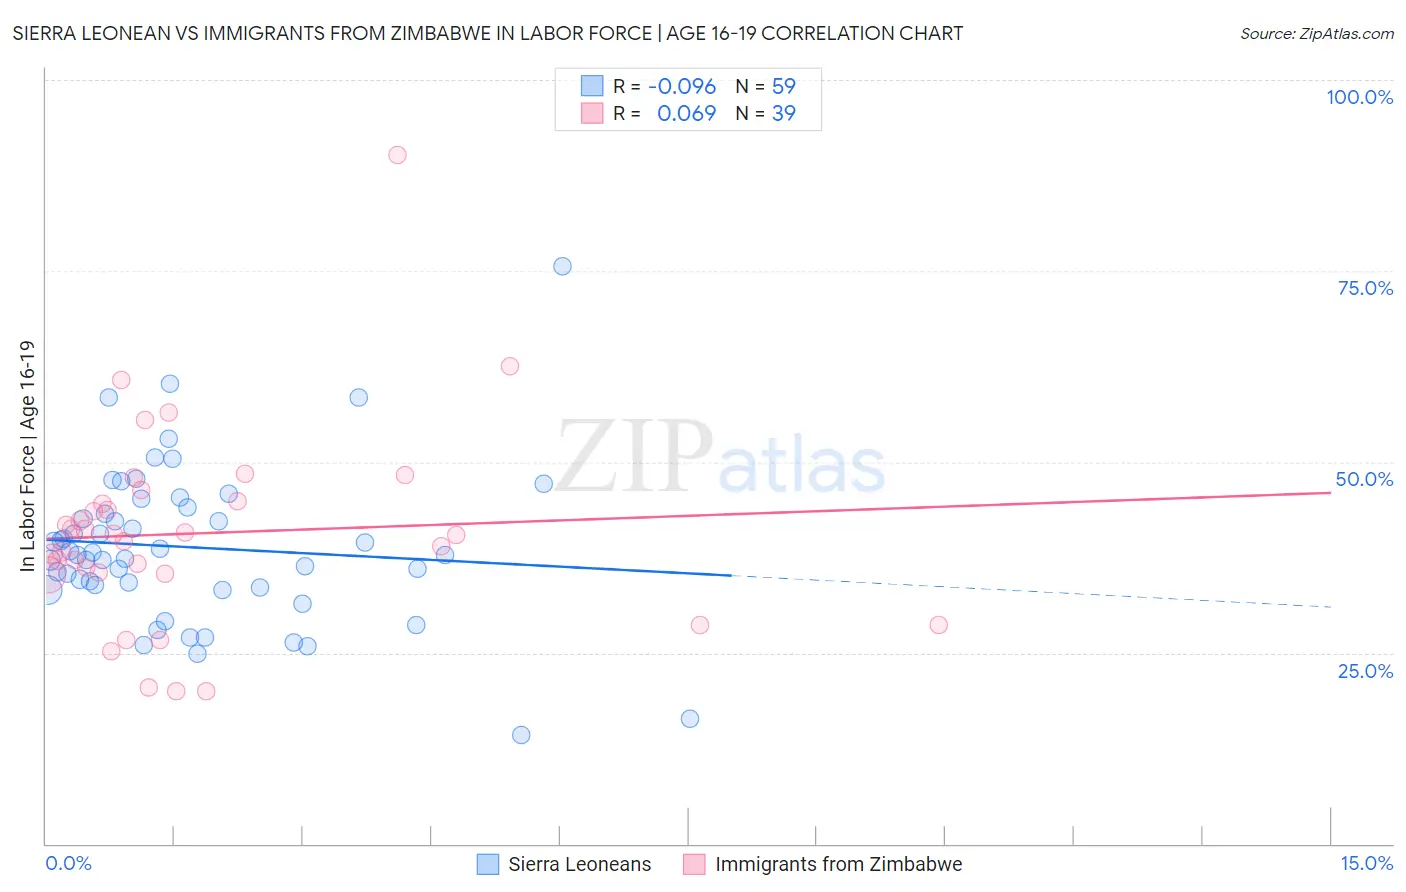
Sierra Leonean vs Immigrants from Zimbabwe In Labor Force | Age 16-19 Correlation Chart
The statistical analysis conducted on geographies consisting of 83,336,332 people shows a slight negative correlation between the proportion of Sierra Leoneans and labor force participation rate among population between the ages 16 and 19 in the United States with a correlation coefficient (R) of -0.096 and weighted average of 37.6%. Similarly, the statistical analysis conducted on geographies consisting of 117,770,176 people shows a slight positive correlation between the proportion of Immigrants from Zimbabwe and labor force participation rate among population between the ages 16 and 19 in the United States with a correlation coefficient (R) of 0.069 and weighted average of 38.0%, a difference of 1.1%.
In Labor Force | Age 16-19 Correlation Summary
| Measurement | Sierra Leonean | Immigrants from Zimbabwe |
| Minimum | 14.3% | 20.0% |
| Maximum | 75.6% | 90.2% |
| Range | 61.3% | 70.2% |
| Mean | 38.8% | 40.6% |
| Median | 37.8% | 40.4% |
| Interquartile 25% (IQ1) | 33.5% | 35.3% |
| Interquartile 75% (IQ3) | 44.1% | 44.9% |
| Interquartile Range (IQR) | 10.6% | 9.6% |
| Standard Deviation (Sample) | 10.4% | 13.0% |
| Standard Deviation (Population) | 10.3% | 12.8% |
Demographics Similar to Sierra Leoneans and Immigrants from Zimbabwe by In Labor Force | Age 16-19
In terms of in labor force | age 16-19, the demographic groups most similar to Sierra Leoneans are Pakistani (37.6%, a difference of 0.030%), Japanese (37.5%, a difference of 0.050%), Paiute (37.5%, a difference of 0.050%), Immigrants from Western Europe (37.5%, a difference of 0.10%), and Syrian (37.6%, a difference of 0.15%). Similarly, the demographic groups most similar to Immigrants from Zimbabwe are Spaniard (38.0%, a difference of 0.030%), New Zealander (38.0%, a difference of 0.050%), African (38.0%, a difference of 0.060%), Choctaw (38.0%, a difference of 0.060%), and Immigrants from Austria (37.9%, a difference of 0.090%).
| Demographics | Rating | Rank | In Labor Force | Age 16-19 |
| Africans | 95.6 /100 | #126 | Exceptional 38.0% |
| Choctaw | 95.6 /100 | #127 | Exceptional 38.0% |
| New Zealanders | 95.6 /100 | #128 | Exceptional 38.0% |
| Spaniards | 95.5 /100 | #129 | Exceptional 38.0% |
| Immigrants | Zimbabwe | 95.4 /100 | #130 | Exceptional 38.0% |
| Immigrants | Austria | 95.0 /100 | #131 | Exceptional 37.9% |
| Immigrants | Oceania | 94.7 /100 | #132 | Exceptional 37.9% |
| Cheyenne | 94.6 /100 | #133 | Exceptional 37.9% |
| Immigrants | Netherlands | 93.7 /100 | #134 | Exceptional 37.8% |
| Macedonians | 93.4 /100 | #135 | Exceptional 37.8% |
| Australians | 93.2 /100 | #136 | Exceptional 37.8% |
| Cajuns | 93.2 /100 | #137 | Exceptional 37.8% |
| Comanche | 91.9 /100 | #138 | Exceptional 37.7% |
| Immigrants | Moldova | 91.9 /100 | #139 | Exceptional 37.7% |
| Estonians | 91.7 /100 | #140 | Exceptional 37.7% |
| Syrians | 90.7 /100 | #141 | Exceptional 37.6% |
| Sierra Leoneans | 89.7 /100 | #142 | Excellent 37.6% |
| Pakistanis | 89.5 /100 | #143 | Excellent 37.6% |
| Japanese | 89.3 /100 | #144 | Excellent 37.5% |
| Paiute | 89.3 /100 | #145 | Excellent 37.5% |
| Immigrants | Western Europe | 88.9 /100 | #146 | Excellent 37.5% |