Sierra Leonean vs Shoshone In Labor Force | Age 16-19
COMPARE
Sierra Leonean
Shoshone
In Labor Force | Age 16-19
In Labor Force | Age 16-19 Comparison
Sierra Leoneans
Shoshone
37.6%
IN LABOR FORCE | AGE 16-19
89.7/ 100
METRIC RATING
142nd/ 347
METRIC RANK
39.3%
IN LABOR FORCE | AGE 16-19
99.7/ 100
METRIC RATING
81st/ 347
METRIC RANK
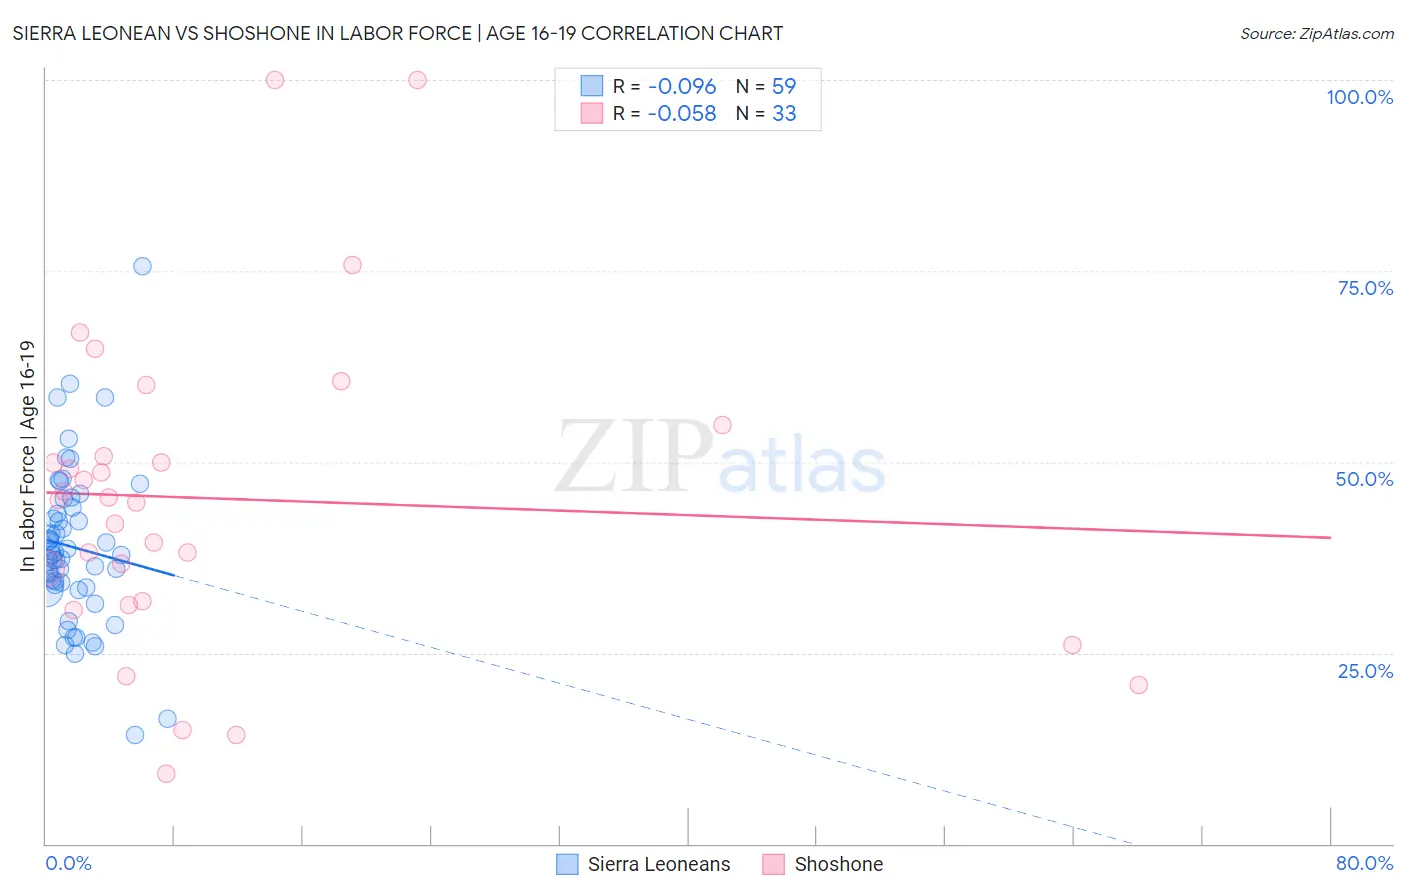
Sierra Leonean vs Shoshone In Labor Force | Age 16-19 Correlation Chart
The statistical analysis conducted on geographies consisting of 83,336,332 people shows a slight negative correlation between the proportion of Sierra Leoneans and labor force participation rate among population between the ages 16 and 19 in the United States with a correlation coefficient (R) of -0.096 and weighted average of 37.6%. Similarly, the statistical analysis conducted on geographies consisting of 66,564,469 people shows a slight negative correlation between the proportion of Shoshone and labor force participation rate among population between the ages 16 and 19 in the United States with a correlation coefficient (R) of -0.058 and weighted average of 39.3%, a difference of 4.6%.
In Labor Force | Age 16-19 Correlation Summary
| Measurement | Sierra Leonean | Shoshone |
| Minimum | 14.3% | 9.1% |
| Maximum | 75.6% | 100.0% |
| Range | 61.3% | 90.9% |
| Mean | 38.8% | 45.2% |
| Median | 37.8% | 45.1% |
| Interquartile 25% (IQ1) | 33.5% | 31.5% |
| Interquartile 75% (IQ3) | 44.1% | 52.7% |
| Interquartile Range (IQR) | 10.6% | 21.2% |
| Standard Deviation (Sample) | 10.4% | 20.9% |
| Standard Deviation (Population) | 10.3% | 20.6% |
Similar Demographics by In Labor Force | Age 16-19
Demographics Similar to Sierra Leoneans by In Labor Force | Age 16-19
In terms of in labor force | age 16-19, the demographic groups most similar to Sierra Leoneans are Pakistani (37.6%, a difference of 0.030%), Japanese (37.5%, a difference of 0.050%), Paiute (37.5%, a difference of 0.050%), Immigrants from Western Europe (37.5%, a difference of 0.10%), and Brazilian (37.5%, a difference of 0.13%).
| Demographics | Rating | Rank | In Labor Force | Age 16-19 |
| Macedonians | 93.4 /100 | #135 | Exceptional 37.8% |
| Australians | 93.2 /100 | #136 | Exceptional 37.8% |
| Cajuns | 93.2 /100 | #137 | Exceptional 37.8% |
| Comanche | 91.9 /100 | #138 | Exceptional 37.7% |
| Immigrants | Moldova | 91.9 /100 | #139 | Exceptional 37.7% |
| Estonians | 91.7 /100 | #140 | Exceptional 37.7% |
| Syrians | 90.7 /100 | #141 | Exceptional 37.6% |
| Sierra Leoneans | 89.7 /100 | #142 | Excellent 37.6% |
| Pakistanis | 89.5 /100 | #143 | Excellent 37.6% |
| Japanese | 89.3 /100 | #144 | Excellent 37.5% |
| Paiute | 89.3 /100 | #145 | Excellent 37.5% |
| Immigrants | Western Europe | 88.9 /100 | #146 | Excellent 37.5% |
| Brazilians | 88.7 /100 | #147 | Excellent 37.5% |
| Romanians | 87.3 /100 | #148 | Excellent 37.5% |
| Native Hawaiians | 85.0 /100 | #149 | Excellent 37.4% |
Demographics Similar to Shoshone by In Labor Force | Age 16-19
In terms of in labor force | age 16-19, the demographic groups most similar to Shoshone are Basque (39.3%, a difference of 0.060%), Spanish (39.3%, a difference of 0.080%), Immigrants from Uganda (39.2%, a difference of 0.21%), Immigrants from Iraq (39.4%, a difference of 0.28%), and Creek (39.1%, a difference of 0.36%).
| Demographics | Rating | Rank | In Labor Force | Age 16-19 |
| Hungarians | 99.9 /100 | #74 | Exceptional 39.8% |
| French American Indians | 99.9 /100 | #75 | Exceptional 39.8% |
| Malaysians | 99.9 /100 | #76 | Exceptional 39.7% |
| Immigrants | Portugal | 99.9 /100 | #77 | Exceptional 39.7% |
| Austrians | 99.8 /100 | #78 | Exceptional 39.5% |
| Marshallese | 99.8 /100 | #79 | Exceptional 39.5% |
| Immigrants | Iraq | 99.8 /100 | #80 | Exceptional 39.4% |
| Shoshone | 99.7 /100 | #81 | Exceptional 39.3% |
| Basques | 99.7 /100 | #82 | Exceptional 39.3% |
| Spanish | 99.7 /100 | #83 | Exceptional 39.3% |
| Immigrants | Uganda | 99.7 /100 | #84 | Exceptional 39.2% |
| Creek | 99.6 /100 | #85 | Exceptional 39.1% |
| Samoans | 99.6 /100 | #86 | Exceptional 39.1% |
| Immigrants | Germany | 99.6 /100 | #87 | Exceptional 39.1% |
| Puget Sound Salish | 99.6 /100 | #88 | Exceptional 39.1% |