Immigrants from Lithuania vs Immigrants from Honduras In Labor Force | Age 25-29
COMPARE
Immigrants from Lithuania
Immigrants from Honduras
In Labor Force | Age 25-29
In Labor Force | Age 25-29 Comparison
Immigrants from Lithuania
Immigrants from Honduras
86.1%
IN LABOR FORCE | AGE 25-29
100.0/ 100
METRIC RATING
12th/ 347
METRIC RANK
83.3%
IN LABOR FORCE | AGE 25-29
0.0/ 100
METRIC RATING
276th/ 347
METRIC RANK
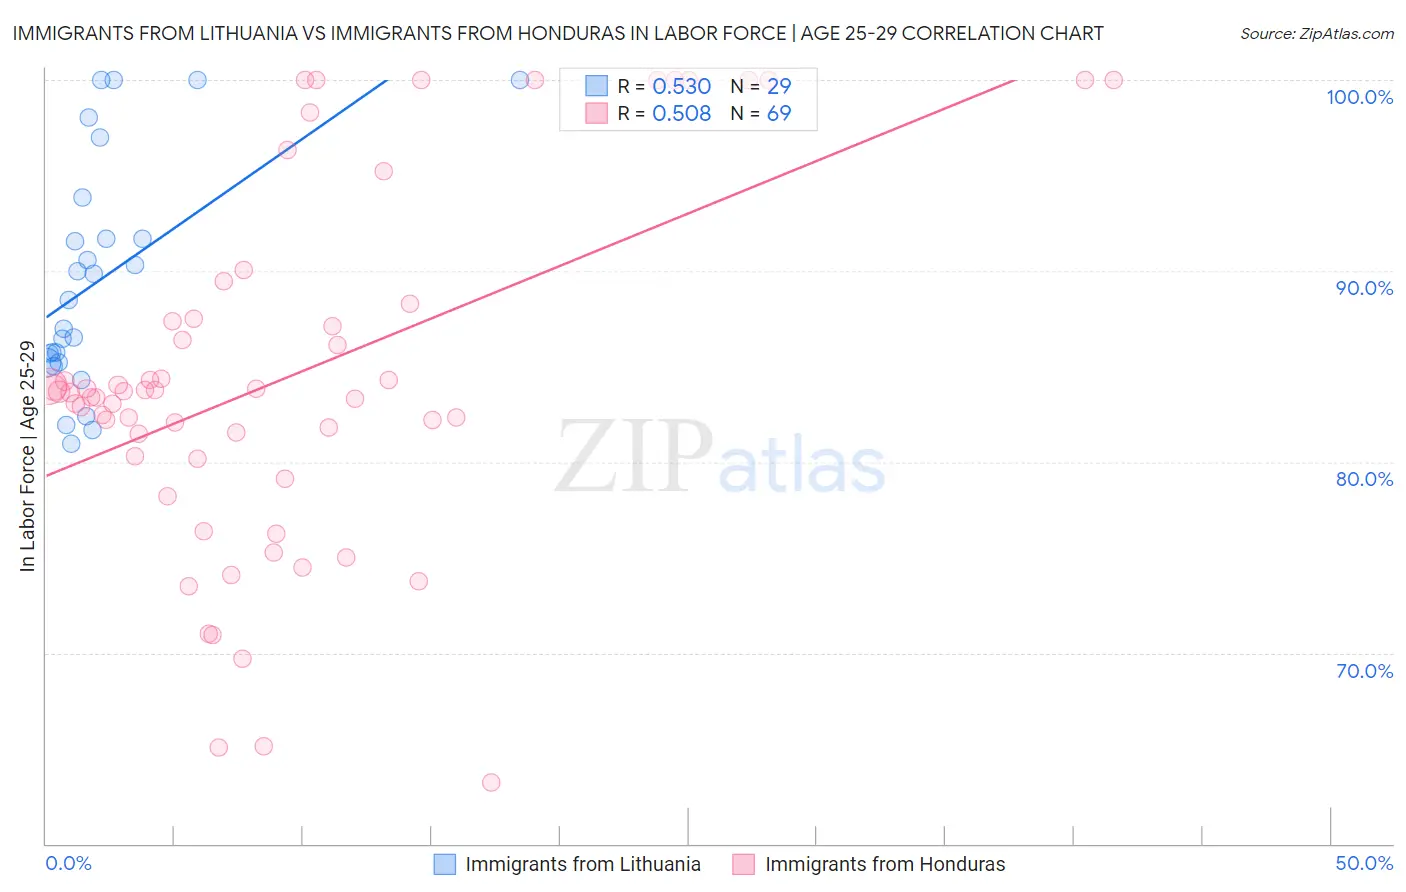
Immigrants from Lithuania vs Immigrants from Honduras In Labor Force | Age 25-29 Correlation Chart
The statistical analysis conducted on geographies consisting of 117,715,877 people shows a substantial positive correlation between the proportion of Immigrants from Lithuania and labor force participation rate among population between the ages 25 and 29 in the United States with a correlation coefficient (R) of 0.530 and weighted average of 86.1%. Similarly, the statistical analysis conducted on geographies consisting of 322,539,731 people shows a substantial positive correlation between the proportion of Immigrants from Honduras and labor force participation rate among population between the ages 25 and 29 in the United States with a correlation coefficient (R) of 0.508 and weighted average of 83.3%, a difference of 3.4%.
In Labor Force | Age 25-29 Correlation Summary
| Measurement | Immigrants from Lithuania | Immigrants from Honduras |
| Minimum | 81.0% | 63.2% |
| Maximum | 100.0% | 100.0% |
| Range | 19.0% | 36.8% |
| Mean | 89.5% | 84.4% |
| Median | 88.5% | 83.7% |
| Interquartile 25% (IQ1) | 85.2% | 80.2% |
| Interquartile 75% (IQ3) | 92.8% | 87.9% |
| Interquartile Range (IQR) | 7.6% | 7.7% |
| Standard Deviation (Sample) | 6.0% | 9.3% |
| Standard Deviation (Population) | 5.9% | 9.3% |
Similar Demographics by In Labor Force | Age 25-29
Demographics Similar to Immigrants from Lithuania by In Labor Force | Age 25-29
In terms of in labor force | age 25-29, the demographic groups most similar to Immigrants from Lithuania are Liberian (86.1%, a difference of 0.010%), Immigrants from Ethiopia (86.1%, a difference of 0.010%), Norwegian (86.1%, a difference of 0.010%), Latvian (86.1%, a difference of 0.040%), and Bolivian (86.1%, a difference of 0.040%).
| Demographics | Rating | Rank | In Labor Force | Age 25-29 |
| Luxembourgers | 100.0 /100 | #5 | Exceptional 86.9% |
| Slovenes | 100.0 /100 | #6 | Exceptional 86.4% |
| Immigrants | Bosnia and Herzegovina | 100.0 /100 | #7 | Exceptional 86.3% |
| Immigrants | Cabo Verde | 100.0 /100 | #8 | Exceptional 86.2% |
| Ethiopians | 100.0 /100 | #9 | Exceptional 86.2% |
| Liberians | 100.0 /100 | #10 | Exceptional 86.1% |
| Immigrants | Ethiopia | 100.0 /100 | #11 | Exceptional 86.1% |
| Immigrants | Lithuania | 100.0 /100 | #12 | Exceptional 86.1% |
| Norwegians | 100.0 /100 | #13 | Exceptional 86.1% |
| Latvians | 100.0 /100 | #14 | Exceptional 86.1% |
| Bolivians | 100.0 /100 | #15 | Exceptional 86.1% |
| Immigrants | Bolivia | 100.0 /100 | #16 | Exceptional 86.1% |
| Bermudans | 100.0 /100 | #17 | Exceptional 86.0% |
| Bulgarians | 100.0 /100 | #18 | Exceptional 86.0% |
| Cape Verdeans | 100.0 /100 | #19 | Exceptional 86.0% |
Demographics Similar to Immigrants from Honduras by In Labor Force | Age 25-29
In terms of in labor force | age 25-29, the demographic groups most similar to Immigrants from Honduras are Samoan (83.3%, a difference of 0.0%), Marshallese (83.3%, a difference of 0.050%), Immigrants from Dominica (83.4%, a difference of 0.070%), African (83.2%, a difference of 0.070%), and Immigrants from Caribbean (83.4%, a difference of 0.080%).
| Demographics | Rating | Rank | In Labor Force | Age 25-29 |
| Immigrants | Barbados | 0.0 /100 | #269 | Tragic 83.4% |
| Basques | 0.0 /100 | #270 | Tragic 83.4% |
| Hondurans | 0.0 /100 | #271 | Tragic 83.4% |
| Immigrants | Caribbean | 0.0 /100 | #272 | Tragic 83.4% |
| Immigrants | Dominica | 0.0 /100 | #273 | Tragic 83.4% |
| Marshallese | 0.0 /100 | #274 | Tragic 83.3% |
| Samoans | 0.0 /100 | #275 | Tragic 83.3% |
| Immigrants | Honduras | 0.0 /100 | #276 | Tragic 83.3% |
| Africans | 0.0 /100 | #277 | Tragic 83.2% |
| Immigrants | Cuba | 0.0 /100 | #278 | Tragic 83.2% |
| British West Indians | 0.0 /100 | #279 | Tragic 83.2% |
| Dominicans | 0.0 /100 | #280 | Tragic 83.2% |
| Immigrants | Dominican Republic | 0.0 /100 | #281 | Tragic 83.1% |
| Americans | 0.0 /100 | #282 | Tragic 83.1% |
| Immigrants | Azores | 0.0 /100 | #283 | Tragic 83.1% |