Nonimmigrants vs Immigrants from Honduras In Labor Force | Age 25-29
COMPARE
Nonimmigrants
Immigrants from Honduras
In Labor Force | Age 25-29
In Labor Force | Age 25-29 Comparison
Nonimmigrants
Immigrants from Honduras
83.7%
IN LABOR FORCE | AGE 25-29
0.3/ 100
METRIC RATING
248th/ 347
METRIC RANK
83.3%
IN LABOR FORCE | AGE 25-29
0.0/ 100
METRIC RATING
276th/ 347
METRIC RANK
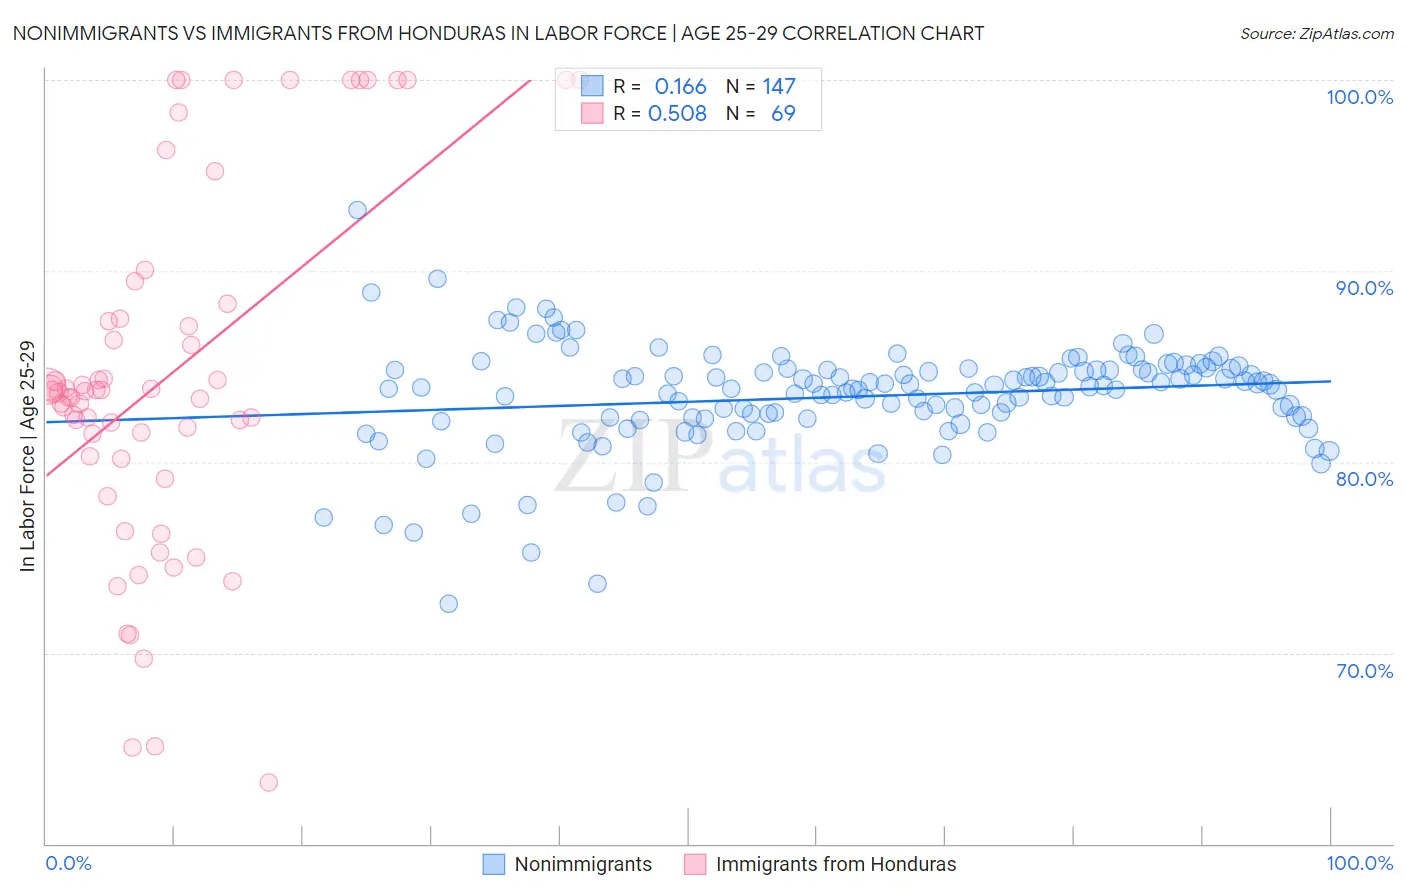
Nonimmigrants vs Immigrants from Honduras In Labor Force | Age 25-29 Correlation Chart
The statistical analysis conducted on geographies consisting of 582,659,660 people shows a poor positive correlation between the proportion of Nonimmigrants and labor force participation rate among population between the ages 25 and 29 in the United States with a correlation coefficient (R) of 0.166 and weighted average of 83.7%. Similarly, the statistical analysis conducted on geographies consisting of 322,539,731 people shows a substantial positive correlation between the proportion of Immigrants from Honduras and labor force participation rate among population between the ages 25 and 29 in the United States with a correlation coefficient (R) of 0.508 and weighted average of 83.3%, a difference of 0.52%.
In Labor Force | Age 25-29 Correlation Summary
| Measurement | Nonimmigrants | Immigrants from Honduras |
| Minimum | 72.6% | 63.2% |
| Maximum | 93.2% | 100.0% |
| Range | 20.6% | 36.8% |
| Mean | 83.4% | 84.4% |
| Median | 83.9% | 83.7% |
| Interquartile 25% (IQ1) | 82.3% | 80.2% |
| Interquartile 75% (IQ3) | 84.8% | 87.9% |
| Interquartile Range (IQR) | 2.5% | 7.7% |
| Standard Deviation (Sample) | 2.8% | 9.3% |
| Standard Deviation (Population) | 2.8% | 9.3% |
Similar Demographics by In Labor Force | Age 25-29
Demographics Similar to Nonimmigrants by In Labor Force | Age 25-29
In terms of in labor force | age 25-29, the demographic groups most similar to Nonimmigrants are Hmong (83.7%, a difference of 0.010%), Immigrants from El Salvador (83.7%, a difference of 0.020%), Cree (83.8%, a difference of 0.030%), Central American (83.7%, a difference of 0.030%), and Bahamian (83.7%, a difference of 0.040%).
| Demographics | Rating | Rank | In Labor Force | Age 25-29 |
| Alsatians | 0.7 /100 | #241 | Tragic 83.9% |
| U.S. Virgin Islanders | 0.6 /100 | #242 | Tragic 83.8% |
| Salvadorans | 0.5 /100 | #243 | Tragic 83.8% |
| Immigrants | Jamaica | 0.4 /100 | #244 | Tragic 83.8% |
| Iroquois | 0.4 /100 | #245 | Tragic 83.8% |
| Cree | 0.3 /100 | #246 | Tragic 83.8% |
| Immigrants | El Salvador | 0.3 /100 | #247 | Tragic 83.7% |
| Immigrants | Nonimmigrants | 0.3 /100 | #248 | Tragic 83.7% |
| Hmong | 0.3 /100 | #249 | Tragic 83.7% |
| Central Americans | 0.2 /100 | #250 | Tragic 83.7% |
| Bahamians | 0.2 /100 | #251 | Tragic 83.7% |
| Guatemalans | 0.2 /100 | #252 | Tragic 83.7% |
| Immigrants | Trinidad and Tobago | 0.2 /100 | #253 | Tragic 83.7% |
| Spaniards | 0.2 /100 | #254 | Tragic 83.7% |
| Haitians | 0.2 /100 | #255 | Tragic 83.7% |
Demographics Similar to Immigrants from Honduras by In Labor Force | Age 25-29
In terms of in labor force | age 25-29, the demographic groups most similar to Immigrants from Honduras are Samoan (83.3%, a difference of 0.0%), Marshallese (83.3%, a difference of 0.050%), Immigrants from Dominica (83.4%, a difference of 0.070%), African (83.2%, a difference of 0.070%), and Immigrants from Caribbean (83.4%, a difference of 0.080%).
| Demographics | Rating | Rank | In Labor Force | Age 25-29 |
| Immigrants | Barbados | 0.0 /100 | #269 | Tragic 83.4% |
| Basques | 0.0 /100 | #270 | Tragic 83.4% |
| Hondurans | 0.0 /100 | #271 | Tragic 83.4% |
| Immigrants | Caribbean | 0.0 /100 | #272 | Tragic 83.4% |
| Immigrants | Dominica | 0.0 /100 | #273 | Tragic 83.4% |
| Marshallese | 0.0 /100 | #274 | Tragic 83.3% |
| Samoans | 0.0 /100 | #275 | Tragic 83.3% |
| Immigrants | Honduras | 0.0 /100 | #276 | Tragic 83.3% |
| Africans | 0.0 /100 | #277 | Tragic 83.2% |
| Immigrants | Cuba | 0.0 /100 | #278 | Tragic 83.2% |
| British West Indians | 0.0 /100 | #279 | Tragic 83.2% |
| Dominicans | 0.0 /100 | #280 | Tragic 83.2% |
| Immigrants | Dominican Republic | 0.0 /100 | #281 | Tragic 83.1% |
| Americans | 0.0 /100 | #282 | Tragic 83.1% |
| Immigrants | Azores | 0.0 /100 | #283 | Tragic 83.1% |