Serbian vs Immigrants from Netherlands In Labor Force | Age 45-54
COMPARE
Serbian
Immigrants from Netherlands
In Labor Force | Age 45-54
In Labor Force | Age 45-54 Comparison
Serbians
Immigrants from Netherlands
83.4%
IN LABOR FORCE | AGE 45-54
97.2/ 100
METRIC RATING
72nd/ 347
METRIC RANK
82.9%
IN LABOR FORCE | AGE 45-54
72.6/ 100
METRIC RATING
150th/ 347
METRIC RANK
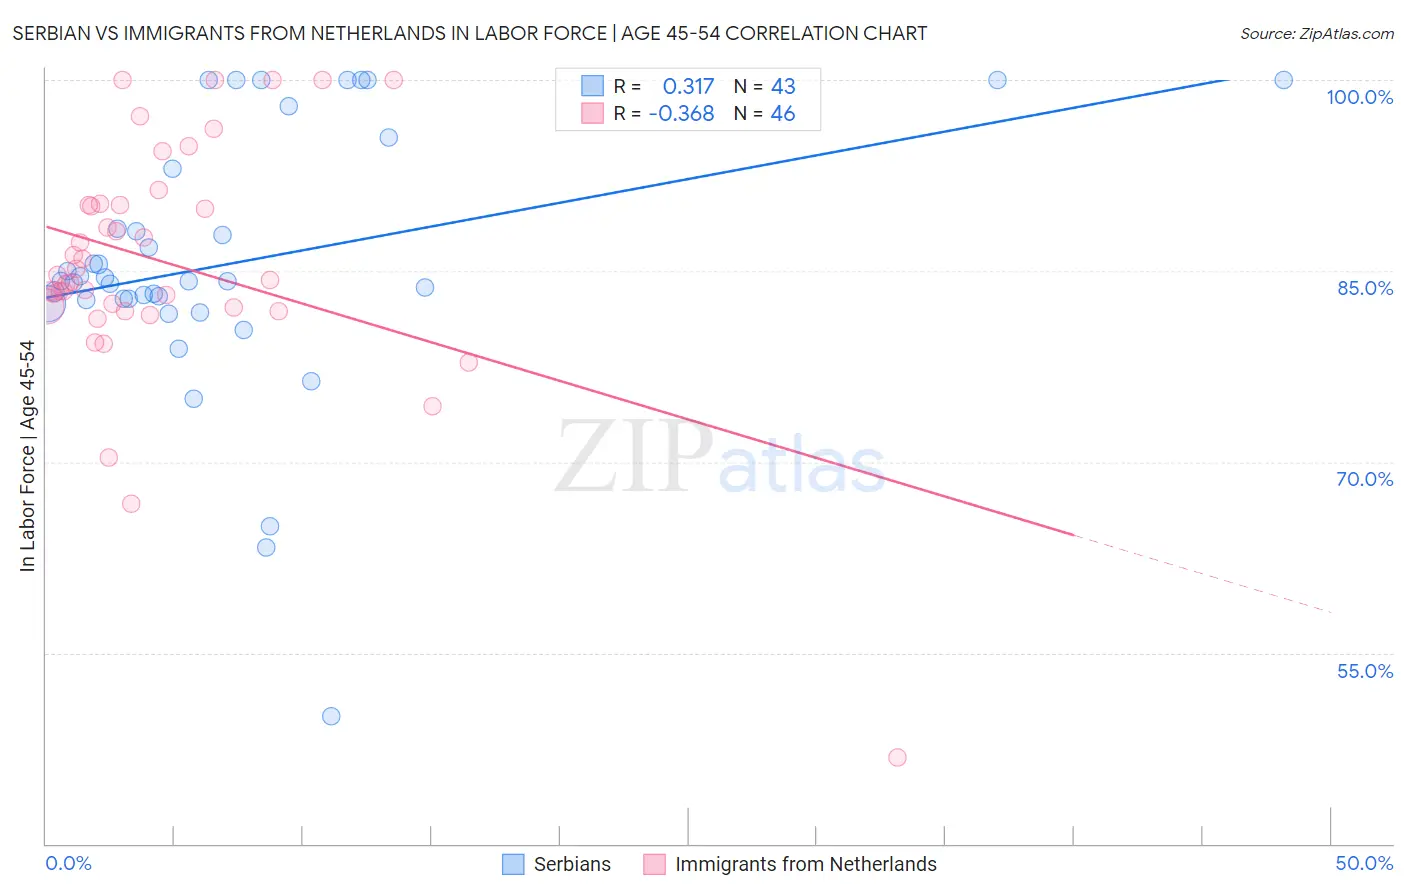
Serbian vs Immigrants from Netherlands In Labor Force | Age 45-54 Correlation Chart
The statistical analysis conducted on geographies consisting of 267,517,171 people shows a mild positive correlation between the proportion of Serbians and labor force participation rate among population between the ages 45 and 54 in the United States with a correlation coefficient (R) of 0.317 and weighted average of 83.4%. Similarly, the statistical analysis conducted on geographies consisting of 237,802,847 people shows a mild negative correlation between the proportion of Immigrants from Netherlands and labor force participation rate among population between the ages 45 and 54 in the United States with a correlation coefficient (R) of -0.368 and weighted average of 82.9%, a difference of 0.56%.
In Labor Force | Age 45-54 Correlation Summary
| Measurement | Serbian | Immigrants from Netherlands |
| Minimum | 50.0% | 46.8% |
| Maximum | 100.0% | 100.0% |
| Range | 50.0% | 53.2% |
| Mean | 85.6% | 85.6% |
| Median | 84.2% | 84.5% |
| Interquartile 25% (IQ1) | 82.7% | 82.1% |
| Interquartile 75% (IQ3) | 93.0% | 90.2% |
| Interquartile Range (IQR) | 10.3% | 8.1% |
| Standard Deviation (Sample) | 10.4% | 9.5% |
| Standard Deviation (Population) | 10.3% | 9.4% |
Similar Demographics by In Labor Force | Age 45-54
Demographics Similar to Serbians by In Labor Force | Age 45-54
In terms of in labor force | age 45-54, the demographic groups most similar to Serbians are Immigrants from Czechoslovakia (83.4%, a difference of 0.010%), Immigrants from Latvia (83.4%, a difference of 0.020%), Colombian (83.4%, a difference of 0.020%), Immigrants from Somalia (83.4%, a difference of 0.020%), and Estonian (83.4%, a difference of 0.020%).
| Demographics | Rating | Rank | In Labor Force | Age 45-54 |
| Egyptians | 97.9 /100 | #65 | Exceptional 83.5% |
| Asians | 97.7 /100 | #66 | Exceptional 83.4% |
| Chileans | 97.7 /100 | #67 | Exceptional 83.4% |
| Immigrants | Colombia | 97.6 /100 | #68 | Exceptional 83.4% |
| Taiwanese | 97.5 /100 | #69 | Exceptional 83.4% |
| Immigrants | Latvia | 97.4 /100 | #70 | Exceptional 83.4% |
| Colombians | 97.3 /100 | #71 | Exceptional 83.4% |
| Serbians | 97.2 /100 | #72 | Exceptional 83.4% |
| Immigrants | Czechoslovakia | 97.1 /100 | #73 | Exceptional 83.4% |
| Immigrants | Somalia | 96.9 /100 | #74 | Exceptional 83.4% |
| Estonians | 96.9 /100 | #75 | Exceptional 83.4% |
| Russians | 96.8 /100 | #76 | Exceptional 83.4% |
| Cubans | 96.7 /100 | #77 | Exceptional 83.4% |
| Immigrants | Egypt | 96.6 /100 | #78 | Exceptional 83.4% |
| Belgians | 96.5 /100 | #79 | Exceptional 83.4% |
Demographics Similar to Immigrants from Netherlands by In Labor Force | Age 45-54
In terms of in labor force | age 45-54, the demographic groups most similar to Immigrants from Netherlands are Immigrants from Sweden (82.9%, a difference of 0.010%), Korean (82.9%, a difference of 0.010%), Slavic (82.9%, a difference of 0.010%), Czechoslovakian (83.0%, a difference of 0.020%), and Immigrants from Nigeria (83.0%, a difference of 0.020%).
| Demographics | Rating | Rank | In Labor Force | Age 45-54 |
| Okinawans | 77.0 /100 | #143 | Good 83.0% |
| Soviet Union | 76.8 /100 | #144 | Good 83.0% |
| Romanians | 75.4 /100 | #145 | Good 83.0% |
| Immigrants | France | 75.3 /100 | #146 | Good 83.0% |
| Czechoslovakians | 74.8 /100 | #147 | Good 83.0% |
| Immigrants | Nigeria | 74.1 /100 | #148 | Good 83.0% |
| Immigrants | Sweden | 73.3 /100 | #149 | Good 82.9% |
| Immigrants | Netherlands | 72.6 /100 | #150 | Good 82.9% |
| Koreans | 71.9 /100 | #151 | Good 82.9% |
| Slavs | 71.5 /100 | #152 | Good 82.9% |
| Immigrants | Indonesia | 70.6 /100 | #153 | Good 82.9% |
| Immigrants | Ghana | 70.3 /100 | #154 | Good 82.9% |
| Immigrants | Philippines | 69.0 /100 | #155 | Good 82.9% |
| Immigrants | Saudi Arabia | 68.8 /100 | #156 | Good 82.9% |
| Immigrants | Australia | 68.2 /100 | #157 | Good 82.9% |