Serbian vs French In Labor Force | Age 45-54
COMPARE
Serbian
French
In Labor Force | Age 45-54
In Labor Force | Age 45-54 Comparison
Serbians
French
83.4%
IN LABOR FORCE | AGE 45-54
97.2/ 100
METRIC RATING
72nd/ 347
METRIC RANK
82.2%
IN LABOR FORCE | AGE 45-54
4.1/ 100
METRIC RATING
219th/ 347
METRIC RANK
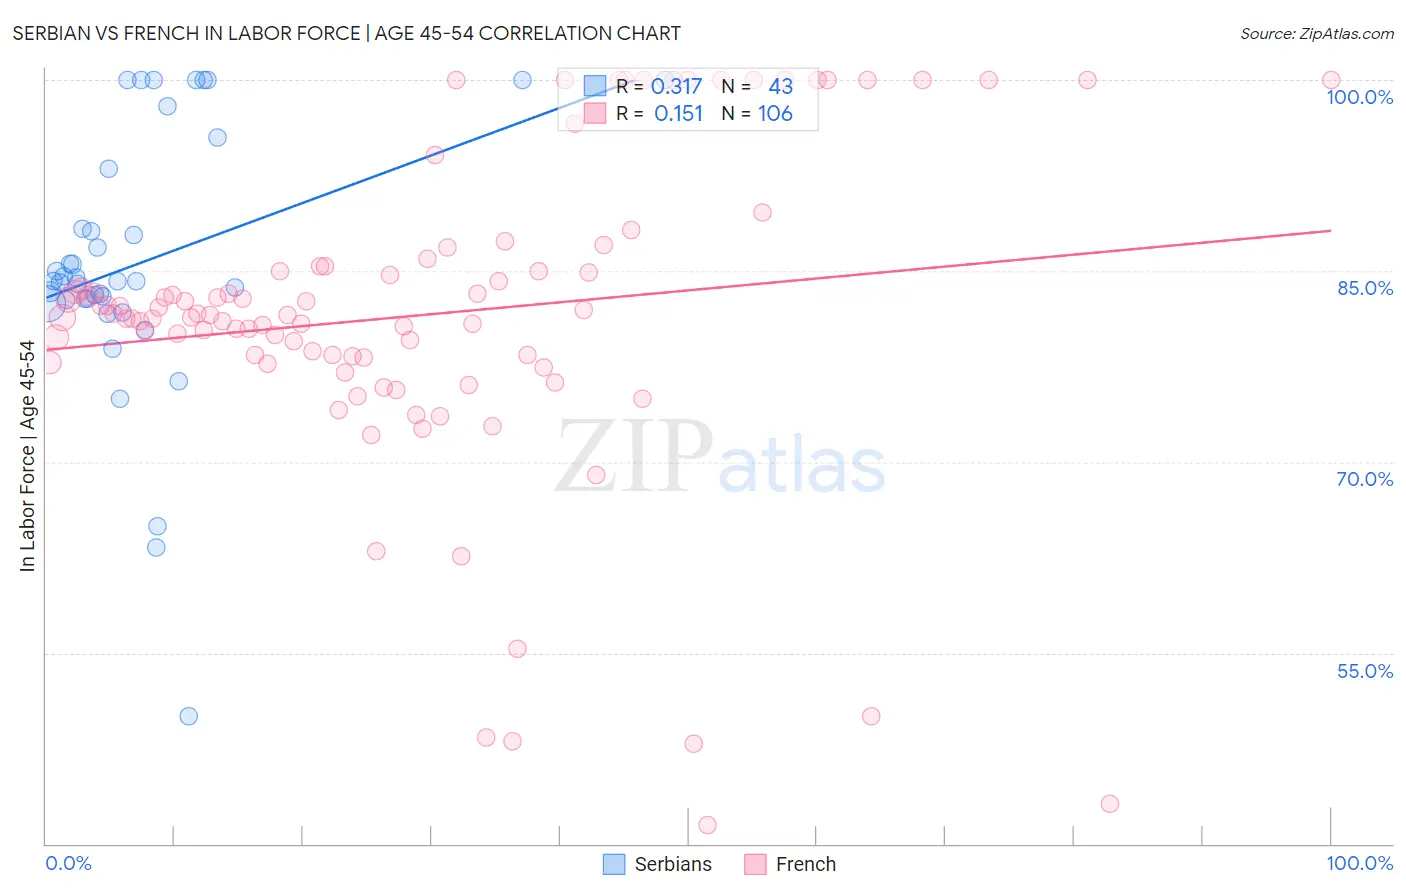
Serbian vs French In Labor Force | Age 45-54 Correlation Chart
The statistical analysis conducted on geographies consisting of 267,517,171 people shows a mild positive correlation between the proportion of Serbians and labor force participation rate among population between the ages 45 and 54 in the United States with a correlation coefficient (R) of 0.317 and weighted average of 83.4%. Similarly, the statistical analysis conducted on geographies consisting of 571,645,026 people shows a poor positive correlation between the proportion of French and labor force participation rate among population between the ages 45 and 54 in the United States with a correlation coefficient (R) of 0.151 and weighted average of 82.2%, a difference of 1.5%.
In Labor Force | Age 45-54 Correlation Summary
| Measurement | Serbian | French |
| Minimum | 50.0% | 41.5% |
| Maximum | 100.0% | 100.0% |
| Range | 50.0% | 58.5% |
| Mean | 85.6% | 81.5% |
| Median | 84.2% | 81.5% |
| Interquartile 25% (IQ1) | 82.7% | 78.2% |
| Interquartile 75% (IQ3) | 93.0% | 85.4% |
| Interquartile Range (IQR) | 10.3% | 7.2% |
| Standard Deviation (Sample) | 10.4% | 12.4% |
| Standard Deviation (Population) | 10.3% | 12.4% |
Similar Demographics by In Labor Force | Age 45-54
Demographics Similar to Serbians by In Labor Force | Age 45-54
In terms of in labor force | age 45-54, the demographic groups most similar to Serbians are Immigrants from Czechoslovakia (83.4%, a difference of 0.010%), Immigrants from Latvia (83.4%, a difference of 0.020%), Colombian (83.4%, a difference of 0.020%), Immigrants from Somalia (83.4%, a difference of 0.020%), and Estonian (83.4%, a difference of 0.020%).
| Demographics | Rating | Rank | In Labor Force | Age 45-54 |
| Egyptians | 97.9 /100 | #65 | Exceptional 83.5% |
| Asians | 97.7 /100 | #66 | Exceptional 83.4% |
| Chileans | 97.7 /100 | #67 | Exceptional 83.4% |
| Immigrants | Colombia | 97.6 /100 | #68 | Exceptional 83.4% |
| Taiwanese | 97.5 /100 | #69 | Exceptional 83.4% |
| Immigrants | Latvia | 97.4 /100 | #70 | Exceptional 83.4% |
| Colombians | 97.3 /100 | #71 | Exceptional 83.4% |
| Serbians | 97.2 /100 | #72 | Exceptional 83.4% |
| Immigrants | Czechoslovakia | 97.1 /100 | #73 | Exceptional 83.4% |
| Immigrants | Somalia | 96.9 /100 | #74 | Exceptional 83.4% |
| Estonians | 96.9 /100 | #75 | Exceptional 83.4% |
| Russians | 96.8 /100 | #76 | Exceptional 83.4% |
| Cubans | 96.7 /100 | #77 | Exceptional 83.4% |
| Immigrants | Egypt | 96.6 /100 | #78 | Exceptional 83.4% |
| Belgians | 96.5 /100 | #79 | Exceptional 83.4% |
Demographics Similar to French by In Labor Force | Age 45-54
In terms of in labor force | age 45-54, the demographic groups most similar to French are English (82.2%, a difference of 0.010%), Portuguese (82.2%, a difference of 0.030%), Bahamian (82.2%, a difference of 0.030%), Panamanian (82.2%, a difference of 0.040%), and Immigrants from Ecuador (82.2%, a difference of 0.040%).
| Demographics | Rating | Rank | In Labor Force | Age 45-54 |
| Ecuadorians | 6.3 /100 | #212 | Tragic 82.3% |
| Immigrants | Uzbekistan | 5.8 /100 | #213 | Tragic 82.3% |
| Immigrants | Panama | 5.6 /100 | #214 | Tragic 82.2% |
| Iraqis | 5.6 /100 | #215 | Tragic 82.2% |
| Scottish | 5.3 /100 | #216 | Tragic 82.2% |
| Portuguese | 4.7 /100 | #217 | Tragic 82.2% |
| English | 4.4 /100 | #218 | Tragic 82.2% |
| French | 4.1 /100 | #219 | Tragic 82.2% |
| Bahamians | 3.6 /100 | #220 | Tragic 82.2% |
| Panamanians | 3.5 /100 | #221 | Tragic 82.2% |
| Immigrants | Ecuador | 3.4 /100 | #222 | Tragic 82.2% |
| Immigrants | Immigrants | 3.1 /100 | #223 | Tragic 82.1% |
| Immigrants | Jamaica | 2.7 /100 | #224 | Tragic 82.1% |
| Immigrants | Oceania | 2.5 /100 | #225 | Tragic 82.1% |
| Immigrants | Caribbean | 2.5 /100 | #226 | Tragic 82.1% |