Serbian vs Immigrants from Kuwait In Labor Force | Age 45-54

COMPARE

Serbian
Race
Ancestry
AfghanAfricanAlaska NativeAlaskan AthabascanAlbanianAleutAlsatianAmericanApacheArabArapahoArgentineanArmenianAssyrian/Chaldean/SyriacAustralianAustrianBahamianBangladeshiBarbadianBasqueBelgianBelizeanBermudanBhutaneseBlackfeetBolivianBrazilianBritishBritish West IndianBulgarianBurmeseCajunCambodianCanadianCape VerdeanCarpatho RusynCelticCentral AmericanCentral American IndianCherokeeCheyenneChickasawChileanChineseChippewaChoctawColombianColvilleComancheCosta RicanCreeCreekCroatianCrowCubanCypriotCzechCzechoslovakianDanishDelawareDominicanDutchDutch West IndianEastern EuropeanEcuadorianEgyptianEnglishEstonianEthiopianEuropeanFijianFilipinoFinnishFrenchFrench American IndianFrench CanadianGermanGerman RussianGhanaianGreekGuamanian/ChamorroGuatemalanGuyaneseHaitianHmongHonduranHopiHoumaHungarianIcelanderIndian (Asian)IndonesianInupiatIranianIraqiIrishIroquoisIsraeliItalianJamaicanJapaneseJordanianKenyanKiowaKoreanLaotianLatvianLebaneseLiberianLithuanianLumbeeLuxembourgerMacedonianMalaysianMalteseMarshalleseMenomineeMexicanMexican American IndianMongolianMoroccanNative HawaiianNavajoNepaleseNew ZealanderNicaraguanNigerianNorthern EuropeanNorwegianOkinawanOsageOttawaPaiutePakistaniPalestinianPanamanianParaguayanPennsylvania GermanPeruvianPimaPolishPortuguesePotawatomiPuebloPuerto RicanPuget Sound SalishRomanianRussianSalvadoranSamoanScandinavianScotch-IrishScottishSeminoleSenegaleseSerbianShoshoneSierra LeoneanSiouxSlavicSlovakSloveneSomaliSouth AfricanSouth AmericanSouth American IndianSoviet UnionSpaniardSpanishSpanish AmericanSpanish American IndianSri LankanSubsaharan AfricanSudaneseSwedishSwissSyrianTaiwaneseThaiTlingit-HaidaTohono O'OdhamTonganTrinidadian and TobagonianTsimshianTurkishU.S. Virgin IslanderUgandanUkrainianUruguayanUteVenezuelanVietnameseWelshWest IndianYakamaYaquiYugoslavianYumanYup'ikZimbabwean
Immigration
NonimmigrantsImmigrantsAfghanistanAfricaAlbaniaArgentinaArmeniaAsiaAustraliaAustriaBahamasBangladeshBarbadosBelarusBelgiumBelizeBoliviaBosnia and HerzegovinaBrazilBulgariaBurma/MyanmarCabo VerdeCambodiaCameroonCanadaCaribbeanCentral AmericaChileChinaColombiaCongoCosta RicaCroatiaCubaCzechoslovakiaDenmarkDominicaDominican RepublicEastern AfricaEastern AsiaEastern EuropeEcuadorEgyptEl SalvadorEnglandEritreaEthiopiaEuropeFijiFranceGermanyGhanaGreeceGrenadaGuatemalaGuyanaHaitiHondurasHong KongHungaryIndiaIndonesiaIranIraqIrelandIsraelItalyJamaicaJapanJordanKazakhstanKenyaKoreaLaosLatin AmericaLatviaLebanonLiberiaLithuaniaMalaysiaMexicoMicronesiaMiddle AfricaMoldovaMoroccoNepalNetherlandsNicaraguaNigeriaNorth AmericaNorth MacedoniaNorthern AfricaNorthern EuropeNorwayOceaniaPakistanPanamaPeruPhilippinesPolandPortugalRomaniaRussiaSaudi ArabiaScotlandSenegalSerbiaSierra LeoneSingaporeSomaliaSouth AfricaSouth AmericaSouth Central AsiaSouth Eastern AsiaSouthern EuropeSpainSri LankaSt. Vincent and the GrenadinesSudanSwedenSwitzerlandSyriaTaiwanThailandTrinidad and TobagoTurkeyUgandaUkraineUruguayUzbekistanVenezuelaVietnamWest IndiesWestern AfricaWestern AsiaWestern EuropeYemenZaireZimbabweAzores
Immigrants from Kuwait
Race
Ancestry
AfghanAfricanAlaska NativeAlaskan AthabascanAlbanianAleutAlsatianAmericanApacheArabArapahoArgentineanArmenianAssyrian/Chaldean/SyriacAustralianAustrianBahamianBangladeshiBarbadianBasqueBelgianBelizeanBermudanBhutaneseBlackfeetBolivianBrazilianBritishBritish West IndianBulgarianBurmeseCajunCambodianCanadianCape VerdeanCarpatho RusynCelticCentral AmericanCentral American IndianCherokeeCheyenneChickasawChileanChineseChippewaChoctawColombianColvilleComancheCosta RicanCreeCreekCroatianCrowCubanCypriotCzechCzechoslovakianDanishDelawareDominicanDutchDutch West IndianEastern EuropeanEcuadorianEgyptianEnglishEstonianEthiopianEuropeanFijianFilipinoFinnishFrenchFrench American IndianFrench CanadianGermanGerman RussianGhanaianGreekGuamanian/ChamorroGuatemalanGuyaneseHaitianHmongHonduranHopiHoumaHungarianIcelanderIndian (Asian)IndonesianInupiatIranianIraqiIrishIroquoisIsraeliItalianJamaicanJapaneseJordanianKenyanKiowaKoreanLaotianLatvianLebaneseLiberianLithuanianLumbeeLuxembourgerMacedonianMalaysianMalteseMarshalleseMenomineeMexicanMexican American IndianMongolianMoroccanNative HawaiianNavajoNepaleseNew ZealanderNicaraguanNigerianNorthern EuropeanNorwegianOkinawanOsageOttawaPaiutePakistaniPalestinianPanamanianParaguayanPennsylvania GermanPeruvianPimaPolishPortuguesePotawatomiPuebloPuerto RicanPuget Sound SalishRomanianRussianSalvadoranSamoanScandinavianScotch-IrishScottishSeminoleSenegaleseShoshoneSierra LeoneanSiouxSlavicSlovakSloveneSomaliSouth AfricanSouth AmericanSouth American IndianSoviet UnionSpaniardSpanishSpanish AmericanSpanish American IndianSri LankanSubsaharan AfricanSudaneseSwedishSwissSyrianTaiwaneseThaiTlingit-HaidaTohono O'OdhamTonganTrinidadian and TobagonianTsimshianTurkishU.S. Virgin IslanderUgandanUkrainianUruguayanUteVenezuelanVietnameseWelshWest IndianYakamaYaquiYugoslavianYumanYup'ikZimbabwean
Immigration
NonimmigrantsImmigrantsAfghanistanAfricaAlbaniaArgentinaArmeniaAsiaAustraliaAustriaBahamasBangladeshBarbadosBelarusBelgiumBelizeBoliviaBosnia and HerzegovinaBrazilBulgariaBurma/MyanmarCabo VerdeCambodiaCameroonCanadaCaribbeanCentral AmericaChileChinaColombiaCongoCosta RicaCroatiaCubaCzechoslovakiaDenmarkDominicaDominican RepublicEastern AfricaEastern AsiaEastern EuropeEcuadorEgyptEl SalvadorEnglandEritreaEthiopiaEuropeFijiFranceGermanyGhanaGreeceGrenadaGuatemalaGuyanaHaitiHondurasHong KongHungaryIndiaIndonesiaIranIraqIrelandIsraelItalyJamaicaJapanJordanKazakhstanKenyaKoreaKuwaitLaosLatin AmericaLatviaLebanonLiberiaLithuaniaMalaysiaMexicoMicronesiaMiddle AfricaMoldovaMoroccoNepalNetherlandsNicaraguaNigeriaNorth AmericaNorth MacedoniaNorthern AfricaNorthern EuropeNorwayOceaniaPakistanPanamaPeruPhilippinesPolandPortugalRomaniaRussiaSaudi ArabiaScotlandSenegalSerbiaSierra LeoneSingaporeSomaliaSouth AfricaSouth AmericaSouth Central AsiaSouth Eastern AsiaSouthern EuropeSpainSri LankaSt. Vincent and the GrenadinesSudanSwedenSwitzerlandSyriaTaiwanThailandTrinidad and TobagoTurkeyUgandaUkraineUruguayUzbekistanVenezuelaVietnamWest IndiesWestern AfricaWestern AsiaWestern EuropeYemenZaireZimbabweAzores
In Labor Force | Age 45-54
Income
Poverty
Unemployment
Labor Participation
Family Structure
Vehicle Availability
Education Level
Disability

In Labor Force | Age 45-54 Comparison

Serbians

Immigrants from Kuwait

Exceptional
Exceptional
83.4%
IN LABOR FORCE | AGE 45-54
97.2/ 100
METRIC RATING
72nd/ 347
METRIC RANK
83.3%
IN LABOR FORCE | AGE 45-54
94.8/ 100
METRIC RATING
96th/ 347
METRIC RANK

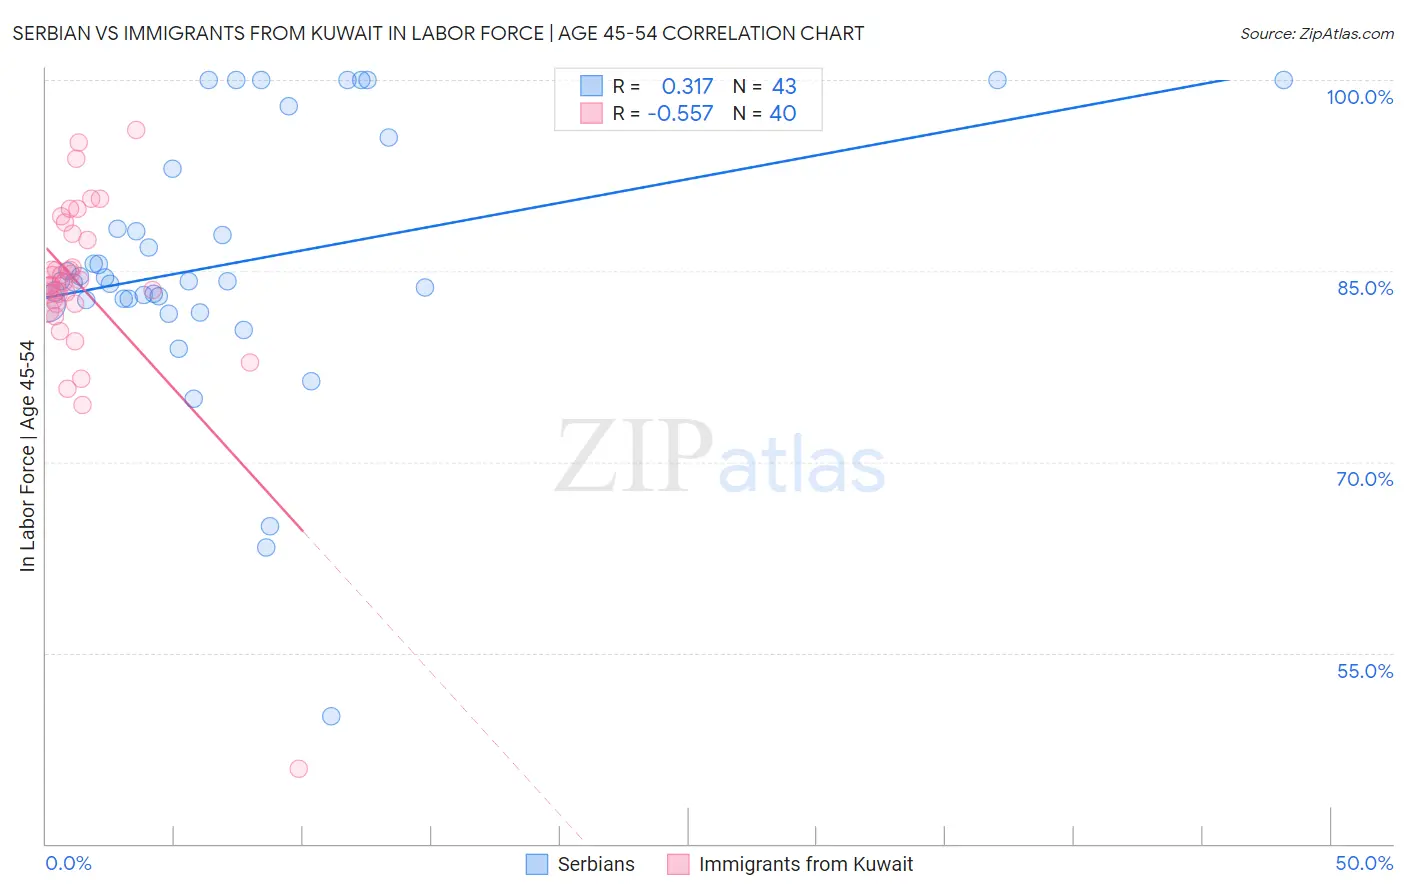
Serbian vs Immigrants from Kuwait In Labor Force | Age 45-54 Correlation Chart

The statistical analysis conducted on geographies consisting of 267,517,171 people shows a mild positive correlation between the proportion of Serbians and labor force participation rate among population between the ages 45 and 54 in the United States with a correlation coefficient (R) of 0.317 and weighted average of 83.4%. Similarly, the statistical analysis conducted on geographies consisting of 136,878,759 people shows a substantial negative correlation between the proportion of Immigrants from Kuwait and labor force participation rate among population between the ages 45 and 54 in the United States with a correlation coefficient (R) of -0.557 and weighted average of 83.3%, a difference of 0.14%.
Serbian vs Immigrants from Kuwait In Labor Force | Age 45-54

In Labor Force | Age 45-54 Correlation Summary

MeasurementSerbianImmigrants from Kuwait
Minimum50.0%45.9%
Maximum100.0%96.1%
Range50.0%50.2%
Mean85.6%83.8%
Median84.2%84.0%
Interquartile 25% (IQ1)82.7%82.4%
Interquartile 75% (IQ3)93.0%87.7%
Interquartile Range (IQR)10.3%5.3%
Standard Deviation (Sample)10.4%7.8%
Standard Deviation (Population)10.3%7.7%

Similar Demographics by In Labor Force | Age 45-54

Demographics Similar to Serbians by In Labor Force | Age 45-54

In terms of in labor force | age 45-54, the demographic groups most similar to Serbians are Immigrants from Czechoslovakia (83.4%, a difference of 0.010%), Immigrants from Latvia (83.4%, a difference of 0.020%), Colombian (83.4%, a difference of 0.020%), Immigrants from Somalia (83.4%, a difference of 0.020%), and Estonian (83.4%, a difference of 0.020%).
DemographicsRating | RankIn Labor Force | Age 45-54
Egyptians
97.9
/100
|
#65
Exceptional
83.5%
Asians
97.7
/100
|
#66
Exceptional
83.4%
Chileans
97.7
/100
|
#67
Exceptional
83.4%
Immigrants | Colombia
97.6
/100
|
#68
Exceptional
83.4%
Taiwanese
97.5
/100
|
#69
Exceptional
83.4%
Immigrants | Latvia
97.4
/100
|
#70
Exceptional
83.4%
Colombians
97.3
/100
|
#71
Exceptional
83.4%
Serbians
97.2
/100
|
#72
Exceptional
83.4%
Immigrants | Czechoslovakia
97.1
/100
|
#73
Exceptional
83.4%
Immigrants | Somalia
96.9
/100
|
#74
Exceptional
83.4%
Estonians
96.9
/100
|
#75
Exceptional
83.4%
Russians
96.8
/100
|
#76
Exceptional
83.4%
Cubans
96.7
/100
|
#77
Exceptional
83.4%
Immigrants | Egypt
96.6
/100
|
#78
Exceptional
83.4%
Belgians
96.5
/100
|
#79
Exceptional
83.4%

Demographics Similar to Immigrants from Kuwait by In Labor Force | Age 45-54

In terms of in labor force | age 45-54, the demographic groups most similar to Immigrants from Kuwait are Immigrants from Argentina (83.3%, a difference of 0.0%), Palestinian (83.3%, a difference of 0.0%), Argentinean (83.3%, a difference of 0.010%), Danish (83.3%, a difference of 0.020%), and Italian (83.3%, a difference of 0.020%).
DemographicsRating | RankIn Labor Force | Age 45-54
Indians (Asian)
95.5
/100
|
#89
Exceptional
83.3%
Immigrants | Japan
95.5
/100
|
#90
Exceptional
83.3%
South Americans
95.5
/100
|
#91
Exceptional
83.3%
Danes
95.3
/100
|
#92
Exceptional
83.3%
Italians
95.1
/100
|
#93
Exceptional
83.3%
Argentineans
94.9
/100
|
#94
Exceptional
83.3%
Immigrants | Argentina
94.9
/100
|
#95
Exceptional
83.3%
Immigrants | Kuwait
94.8
/100
|
#96
Exceptional
83.3%
Palestinians
94.8
/100
|
#97
Exceptional
83.3%
Maltese
94.4
/100
|
#98
Exceptional
83.3%
Immigrants | Middle Africa
94.3
/100
|
#99
Exceptional
83.3%
Mongolians
94.2
/100
|
#100
Exceptional
83.3%
Immigrants | Belarus
94.1
/100
|
#101
Exceptional
83.3%
Immigrants | Singapore
93.9
/100
|
#102
Exceptional
83.3%
Albanians
93.9
/100
|
#103
Exceptional
83.3%