Serbian vs Immigrants from Asia In Labor Force | Age 45-54
COMPARE
Serbian
Immigrants from Asia
In Labor Force | Age 45-54
In Labor Force | Age 45-54 Comparison
Serbians
Immigrants from Asia
83.4%
IN LABOR FORCE | AGE 45-54
97.2/ 100
METRIC RATING
72nd/ 347
METRIC RANK
83.3%
IN LABOR FORCE | AGE 45-54
95.6/ 100
METRIC RATING
88th/ 347
METRIC RANK
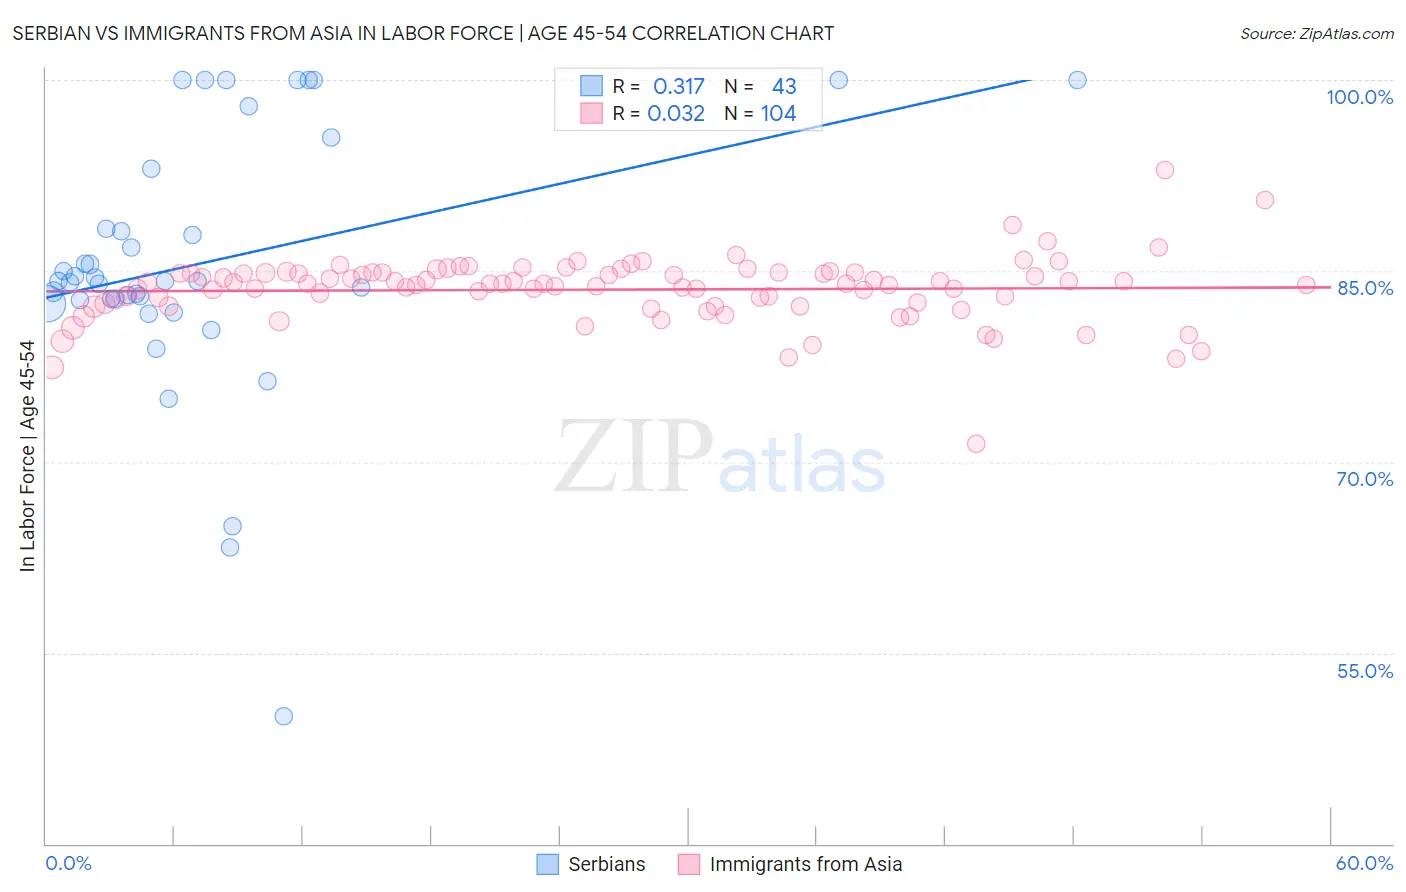
Serbian vs Immigrants from Asia In Labor Force | Age 45-54 Correlation Chart
The statistical analysis conducted on geographies consisting of 267,517,171 people shows a mild positive correlation between the proportion of Serbians and labor force participation rate among population between the ages 45 and 54 in the United States with a correlation coefficient (R) of 0.317 and weighted average of 83.4%. Similarly, the statistical analysis conducted on geographies consisting of 548,472,608 people shows no correlation between the proportion of Immigrants from Asia and labor force participation rate among population between the ages 45 and 54 in the United States with a correlation coefficient (R) of 0.032 and weighted average of 83.3%, a difference of 0.10%.
In Labor Force | Age 45-54 Correlation Summary
| Measurement | Serbian | Immigrants from Asia |
| Minimum | 50.0% | 71.4% |
| Maximum | 100.0% | 92.9% |
| Range | 50.0% | 21.5% |
| Mean | 85.6% | 83.5% |
| Median | 84.2% | 84.0% |
| Interquartile 25% (IQ1) | 82.7% | 82.3% |
| Interquartile 75% (IQ3) | 93.0% | 84.8% |
| Interquartile Range (IQR) | 10.3% | 2.5% |
| Standard Deviation (Sample) | 10.4% | 2.6% |
| Standard Deviation (Population) | 10.3% | 2.6% |
Demographics Similar to Serbians and Immigrants from Asia by In Labor Force | Age 45-54
In terms of in labor force | age 45-54, the demographic groups most similar to Serbians are Immigrants from Czechoslovakia (83.4%, a difference of 0.010%), Immigrants from Latvia (83.4%, a difference of 0.020%), Colombian (83.4%, a difference of 0.020%), Immigrants from Somalia (83.4%, a difference of 0.020%), and Estonian (83.4%, a difference of 0.020%). Similarly, the demographic groups most similar to Immigrants from Asia are Immigrants from Eastern Europe (83.3%, a difference of 0.0%), Indian (Asian) (83.3%, a difference of 0.0%), Immigrants from Japan (83.3%, a difference of 0.0%), Immigrants from Northern Africa (83.3%, a difference of 0.010%), and Immigrants from Bosnia and Herzegovina (83.3%, a difference of 0.020%).
| Demographics | Rating | Rank | In Labor Force | Age 45-54 |
| Immigrants | Latvia | 97.4 /100 | #70 | Exceptional 83.4% |
| Colombians | 97.3 /100 | #71 | Exceptional 83.4% |
| Serbians | 97.2 /100 | #72 | Exceptional 83.4% |
| Immigrants | Czechoslovakia | 97.1 /100 | #73 | Exceptional 83.4% |
| Immigrants | Somalia | 96.9 /100 | #74 | Exceptional 83.4% |
| Estonians | 96.9 /100 | #75 | Exceptional 83.4% |
| Russians | 96.8 /100 | #76 | Exceptional 83.4% |
| Cubans | 96.7 /100 | #77 | Exceptional 83.4% |
| Immigrants | Egypt | 96.6 /100 | #78 | Exceptional 83.4% |
| Belgians | 96.5 /100 | #79 | Exceptional 83.4% |
| Immigrants | Croatia | 96.5 /100 | #80 | Exceptional 83.4% |
| Jordanians | 96.4 /100 | #81 | Exceptional 83.4% |
| Immigrants | Eastern Asia | 96.3 /100 | #82 | Exceptional 83.4% |
| Immigrants | Zimbabwe | 96.3 /100 | #83 | Exceptional 83.4% |
| Immigrants | Bosnia and Herzegovina | 96.0 /100 | #84 | Exceptional 83.3% |
| Greeks | 95.9 /100 | #85 | Exceptional 83.3% |
| Immigrants | Northern Africa | 95.7 /100 | #86 | Exceptional 83.3% |
| Immigrants | Eastern Europe | 95.6 /100 | #87 | Exceptional 83.3% |
| Immigrants | Asia | 95.6 /100 | #88 | Exceptional 83.3% |
| Indians (Asian) | 95.5 /100 | #89 | Exceptional 83.3% |
| Immigrants | Japan | 95.5 /100 | #90 | Exceptional 83.3% |