Serbian vs Immigrants from Ethiopia In Labor Force | Age 45-54
COMPARE
Serbian
Immigrants from Ethiopia
In Labor Force | Age 45-54
In Labor Force | Age 45-54 Comparison
Serbians
Immigrants from Ethiopia
83.4%
IN LABOR FORCE | AGE 45-54
97.2/ 100
METRIC RATING
72nd/ 347
METRIC RANK
84.8%
IN LABOR FORCE | AGE 45-54
100.0/ 100
METRIC RATING
4th/ 347
METRIC RANK
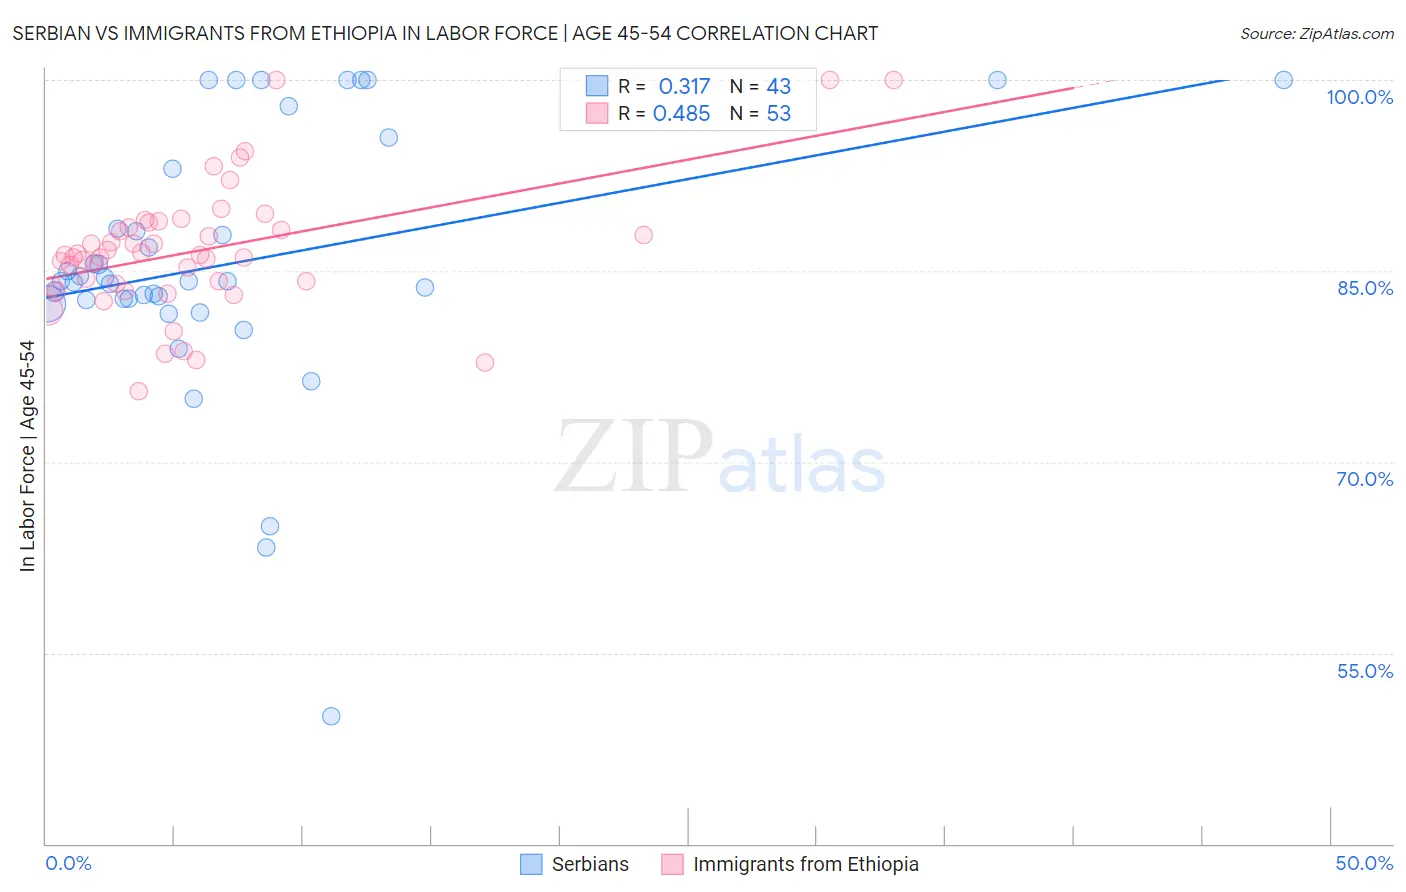
Serbian vs Immigrants from Ethiopia In Labor Force | Age 45-54 Correlation Chart
The statistical analysis conducted on geographies consisting of 267,517,171 people shows a mild positive correlation between the proportion of Serbians and labor force participation rate among population between the ages 45 and 54 in the United States with a correlation coefficient (R) of 0.317 and weighted average of 83.4%. Similarly, the statistical analysis conducted on geographies consisting of 211,453,316 people shows a moderate positive correlation between the proportion of Immigrants from Ethiopia and labor force participation rate among population between the ages 45 and 54 in the United States with a correlation coefficient (R) of 0.485 and weighted average of 84.8%, a difference of 1.7%.
In Labor Force | Age 45-54 Correlation Summary
| Measurement | Serbian | Immigrants from Ethiopia |
| Minimum | 50.0% | 75.6% |
| Maximum | 100.0% | 100.0% |
| Range | 50.0% | 24.4% |
| Mean | 85.6% | 86.6% |
| Median | 84.2% | 86.2% |
| Interquartile 25% (IQ1) | 82.7% | 83.9% |
| Interquartile 75% (IQ3) | 93.0% | 88.6% |
| Interquartile Range (IQR) | 10.3% | 4.7% |
| Standard Deviation (Sample) | 10.4% | 5.1% |
| Standard Deviation (Population) | 10.3% | 5.0% |
Similar Demographics by In Labor Force | Age 45-54
Demographics Similar to Serbians by In Labor Force | Age 45-54
In terms of in labor force | age 45-54, the demographic groups most similar to Serbians are Immigrants from Czechoslovakia (83.4%, a difference of 0.010%), Immigrants from Latvia (83.4%, a difference of 0.020%), Colombian (83.4%, a difference of 0.020%), Immigrants from Somalia (83.4%, a difference of 0.020%), and Estonian (83.4%, a difference of 0.020%).
| Demographics | Rating | Rank | In Labor Force | Age 45-54 |
| Egyptians | 97.9 /100 | #65 | Exceptional 83.5% |
| Asians | 97.7 /100 | #66 | Exceptional 83.4% |
| Chileans | 97.7 /100 | #67 | Exceptional 83.4% |
| Immigrants | Colombia | 97.6 /100 | #68 | Exceptional 83.4% |
| Taiwanese | 97.5 /100 | #69 | Exceptional 83.4% |
| Immigrants | Latvia | 97.4 /100 | #70 | Exceptional 83.4% |
| Colombians | 97.3 /100 | #71 | Exceptional 83.4% |
| Serbians | 97.2 /100 | #72 | Exceptional 83.4% |
| Immigrants | Czechoslovakia | 97.1 /100 | #73 | Exceptional 83.4% |
| Immigrants | Somalia | 96.9 /100 | #74 | Exceptional 83.4% |
| Estonians | 96.9 /100 | #75 | Exceptional 83.4% |
| Russians | 96.8 /100 | #76 | Exceptional 83.4% |
| Cubans | 96.7 /100 | #77 | Exceptional 83.4% |
| Immigrants | Egypt | 96.6 /100 | #78 | Exceptional 83.4% |
| Belgians | 96.5 /100 | #79 | Exceptional 83.4% |
Demographics Similar to Immigrants from Ethiopia by In Labor Force | Age 45-54
In terms of in labor force | age 45-54, the demographic groups most similar to Immigrants from Ethiopia are Ethiopian (84.8%, a difference of 0.080%), Bolivian (84.9%, a difference of 0.12%), Immigrants from India (84.7%, a difference of 0.19%), Luxembourger (85.0%, a difference of 0.21%), and Immigrants from Cameroon (84.6%, a difference of 0.25%).
| Demographics | Rating | Rank | In Labor Force | Age 45-54 |
| Immigrants | Bolivia | 100.0 /100 | #1 | Exceptional 85.3% |
| Luxembourgers | 100.0 /100 | #2 | Exceptional 85.0% |
| Bolivians | 100.0 /100 | #3 | Exceptional 84.9% |
| Immigrants | Ethiopia | 100.0 /100 | #4 | Exceptional 84.8% |
| Ethiopians | 100.0 /100 | #5 | Exceptional 84.8% |
| Immigrants | India | 100.0 /100 | #6 | Exceptional 84.7% |
| Immigrants | Cameroon | 100.0 /100 | #7 | Exceptional 84.6% |
| Sierra Leoneans | 100.0 /100 | #8 | Exceptional 84.5% |
| Immigrants | Sierra Leone | 100.0 /100 | #9 | Exceptional 84.4% |
| Norwegians | 100.0 /100 | #10 | Exceptional 84.4% |
| Thais | 100.0 /100 | #11 | Exceptional 84.3% |
| Bulgarians | 100.0 /100 | #12 | Exceptional 84.2% |
| Chinese | 99.9 /100 | #13 | Exceptional 84.1% |
| Cambodians | 99.9 /100 | #14 | Exceptional 84.1% |
| Cypriots | 99.9 /100 | #15 | Exceptional 84.1% |