Immigrants from Liberia vs Immigrants from Netherlands In Labor Force | Age 45-54
COMPARE
Immigrants from Liberia
Immigrants from Netherlands
In Labor Force | Age 45-54
In Labor Force | Age 45-54 Comparison
Immigrants from Liberia
Immigrants from Netherlands
82.7%
IN LABOR FORCE | AGE 45-54
47.9/ 100
METRIC RATING
175th/ 347
METRIC RANK
82.9%
IN LABOR FORCE | AGE 45-54
72.6/ 100
METRIC RATING
150th/ 347
METRIC RANK
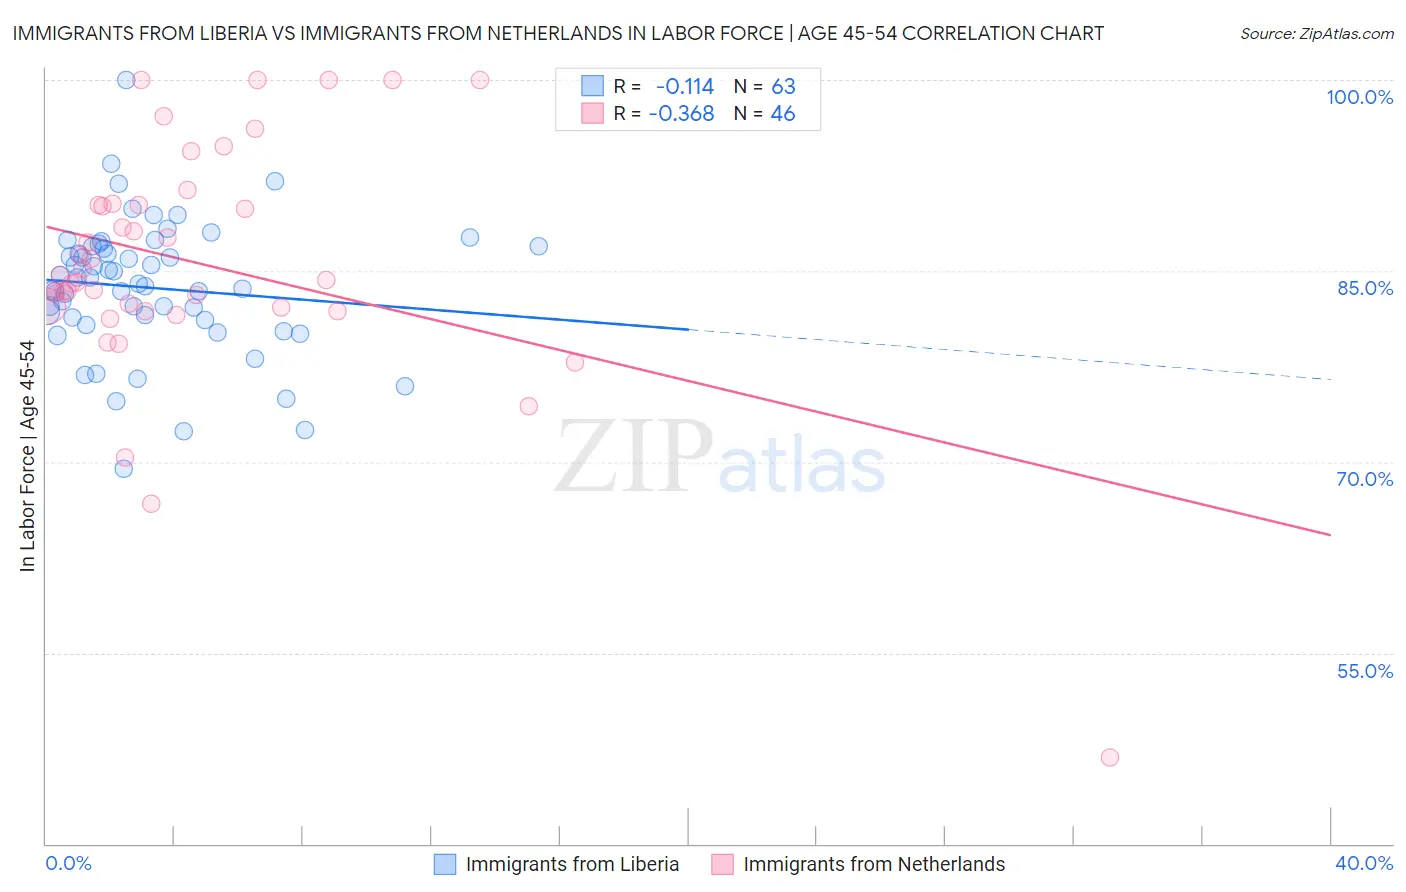
Immigrants from Liberia vs Immigrants from Netherlands In Labor Force | Age 45-54 Correlation Chart
The statistical analysis conducted on geographies consisting of 135,233,858 people shows a poor negative correlation between the proportion of Immigrants from Liberia and labor force participation rate among population between the ages 45 and 54 in the United States with a correlation coefficient (R) of -0.114 and weighted average of 82.7%. Similarly, the statistical analysis conducted on geographies consisting of 237,802,847 people shows a mild negative correlation between the proportion of Immigrants from Netherlands and labor force participation rate among population between the ages 45 and 54 in the United States with a correlation coefficient (R) of -0.368 and weighted average of 82.9%, a difference of 0.23%.
In Labor Force | Age 45-54 Correlation Summary
| Measurement | Immigrants from Liberia | Immigrants from Netherlands |
| Minimum | 69.4% | 46.8% |
| Maximum | 100.0% | 100.0% |
| Range | 30.6% | 53.2% |
| Mean | 83.7% | 85.6% |
| Median | 84.0% | 84.5% |
| Interquartile 25% (IQ1) | 81.1% | 82.1% |
| Interquartile 75% (IQ3) | 86.9% | 90.2% |
| Interquartile Range (IQR) | 5.8% | 8.1% |
| Standard Deviation (Sample) | 5.3% | 9.5% |
| Standard Deviation (Population) | 5.2% | 9.4% |
Similar Demographics by In Labor Force | Age 45-54
Demographics Similar to Immigrants from Liberia by In Labor Force | Age 45-54
In terms of in labor force | age 45-54, the demographic groups most similar to Immigrants from Liberia are Northern European (82.7%, a difference of 0.010%), Nicaraguan (82.8%, a difference of 0.020%), Costa Rican (82.8%, a difference of 0.020%), Icelander (82.8%, a difference of 0.030%), and Immigrants from Nicaragua (82.7%, a difference of 0.030%).
| Demographics | Rating | Rank | In Labor Force | Age 45-54 |
| Immigrants | South Africa | 55.8 /100 | #168 | Average 82.8% |
| Immigrants | Western Africa | 54.1 /100 | #169 | Average 82.8% |
| Pakistanis | 53.2 /100 | #170 | Average 82.8% |
| Immigrants | Zaire | 52.9 /100 | #171 | Average 82.8% |
| Icelanders | 51.8 /100 | #172 | Average 82.8% |
| Nicaraguans | 50.3 /100 | #173 | Average 82.8% |
| Costa Ricans | 50.0 /100 | #174 | Average 82.8% |
| Immigrants | Liberia | 47.9 /100 | #175 | Average 82.7% |
| Northern Europeans | 46.9 /100 | #176 | Average 82.7% |
| Immigrants | Nicaragua | 44.6 /100 | #177 | Average 82.7% |
| Nigerians | 40.5 /100 | #178 | Average 82.7% |
| Immigrants | Switzerland | 39.4 /100 | #179 | Fair 82.7% |
| Hungarians | 38.0 /100 | #180 | Fair 82.7% |
| Israelis | 37.7 /100 | #181 | Fair 82.7% |
| Immigrants | Hungary | 37.1 /100 | #182 | Fair 82.7% |
Demographics Similar to Immigrants from Netherlands by In Labor Force | Age 45-54
In terms of in labor force | age 45-54, the demographic groups most similar to Immigrants from Netherlands are Immigrants from Sweden (82.9%, a difference of 0.010%), Korean (82.9%, a difference of 0.010%), Slavic (82.9%, a difference of 0.010%), Czechoslovakian (83.0%, a difference of 0.020%), and Immigrants from Nigeria (83.0%, a difference of 0.020%).
| Demographics | Rating | Rank | In Labor Force | Age 45-54 |
| Okinawans | 77.0 /100 | #143 | Good 83.0% |
| Soviet Union | 76.8 /100 | #144 | Good 83.0% |
| Romanians | 75.4 /100 | #145 | Good 83.0% |
| Immigrants | France | 75.3 /100 | #146 | Good 83.0% |
| Czechoslovakians | 74.8 /100 | #147 | Good 83.0% |
| Immigrants | Nigeria | 74.1 /100 | #148 | Good 83.0% |
| Immigrants | Sweden | 73.3 /100 | #149 | Good 82.9% |
| Immigrants | Netherlands | 72.6 /100 | #150 | Good 82.9% |
| Koreans | 71.9 /100 | #151 | Good 82.9% |
| Slavs | 71.5 /100 | #152 | Good 82.9% |
| Immigrants | Indonesia | 70.6 /100 | #153 | Good 82.9% |
| Immigrants | Ghana | 70.3 /100 | #154 | Good 82.9% |
| Immigrants | Philippines | 69.0 /100 | #155 | Good 82.9% |
| Immigrants | Saudi Arabia | 68.8 /100 | #156 | Good 82.9% |
| Immigrants | Australia | 68.2 /100 | #157 | Good 82.9% |