Serbian vs Soviet Union In Labor Force | Age 20-64
COMPARE
Serbian
Soviet Union
In Labor Force | Age 20-64
In Labor Force | Age 20-64 Comparison
Serbians
Soviet Union
80.3%
IN LABOR FORCE | AGE 20-64
98.9/ 100
METRIC RATING
58th/ 347
METRIC RANK
80.2%
IN LABOR FORCE | AGE 20-64
98.5/ 100
METRIC RATING
71st/ 347
METRIC RANK
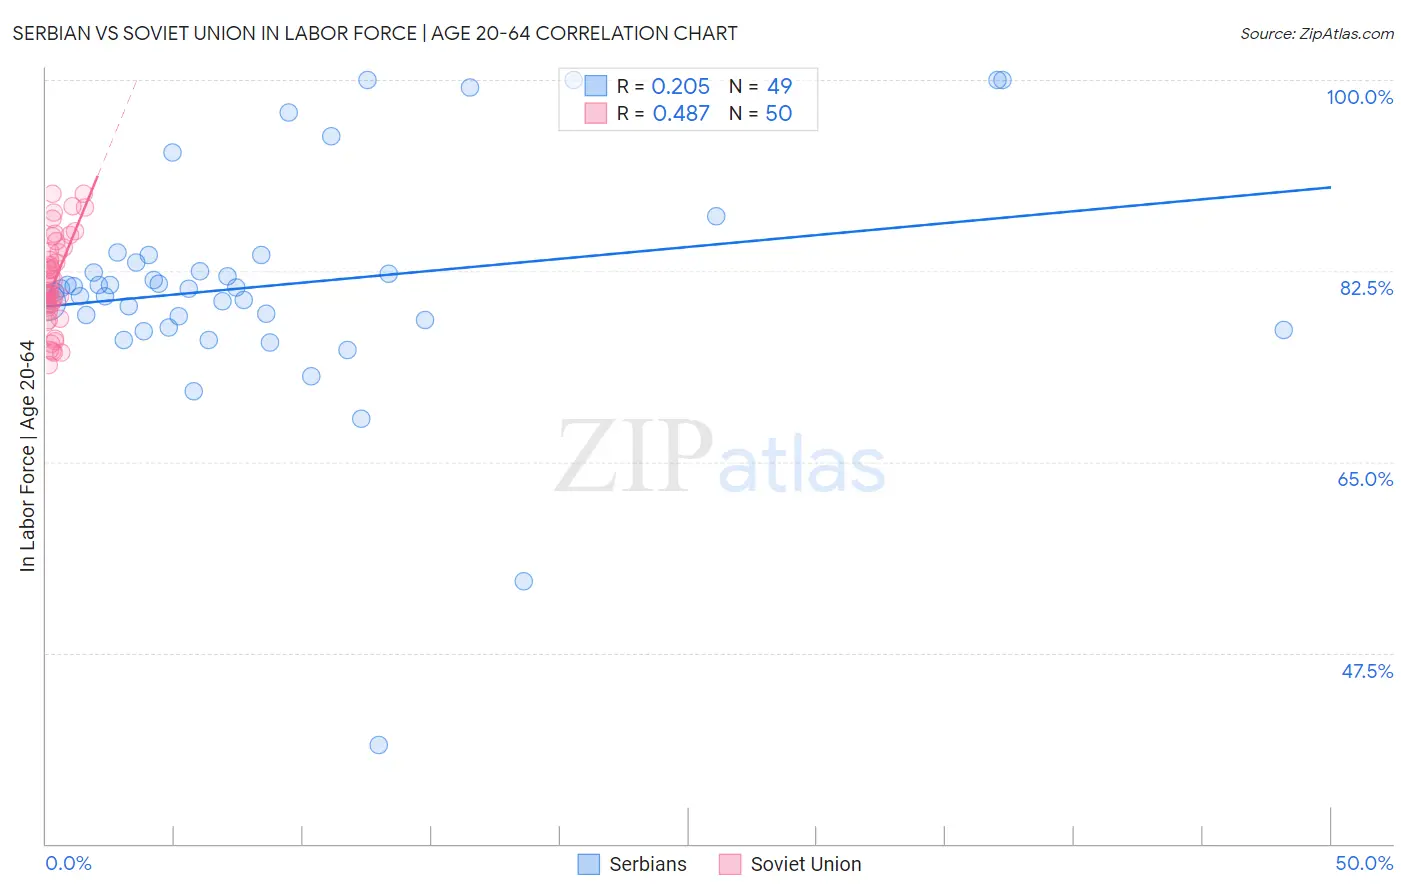
Serbian vs Soviet Union In Labor Force | Age 20-64 Correlation Chart
The statistical analysis conducted on geographies consisting of 267,654,798 people shows a weak positive correlation between the proportion of Serbians and labor force participation rate among population between the ages 20 and 64 in the United States with a correlation coefficient (R) of 0.205 and weighted average of 80.3%. Similarly, the statistical analysis conducted on geographies consisting of 43,514,626 people shows a moderate positive correlation between the proportion of Soviet Union and labor force participation rate among population between the ages 20 and 64 in the United States with a correlation coefficient (R) of 0.487 and weighted average of 80.2%, a difference of 0.060%.
In Labor Force | Age 20-64 Correlation Summary
| Measurement | Serbian | Soviet Union |
| Minimum | 39.1% | 73.8% |
| Maximum | 100.0% | 89.6% |
| Range | 60.9% | 15.8% |
| Mean | 81.2% | 81.5% |
| Median | 80.9% | 81.0% |
| Interquartile 25% (IQ1) | 77.7% | 79.2% |
| Interquartile 75% (IQ3) | 83.6% | 84.3% |
| Interquartile Range (IQR) | 6.0% | 5.1% |
| Standard Deviation (Sample) | 10.6% | 4.1% |
| Standard Deviation (Population) | 10.5% | 4.1% |
Demographics Similar to Serbians and Soviet Union by In Labor Force | Age 20-64
In terms of in labor force | age 20-64, the demographic groups most similar to Serbians are Swedish (80.3%, a difference of 0.0%), Immigrants from Northern Africa (80.3%, a difference of 0.010%), Afghan (80.3%, a difference of 0.010%), Tongan (80.3%, a difference of 0.010%), and Burmese (80.3%, a difference of 0.010%). Similarly, the demographic groups most similar to Soviet Union are Bhutanese (80.2%, a difference of 0.010%), Albanian (80.2%, a difference of 0.010%), Immigrants from Turkey (80.2%, a difference of 0.010%), Eastern European (80.2%, a difference of 0.010%), and Macedonian (80.2%, a difference of 0.020%).
| Demographics | Rating | Rank | In Labor Force | Age 20-64 |
| Peruvians | 99.1 /100 | #54 | Exceptional 80.3% |
| Immigrants | Cabo Verde | 99.0 /100 | #55 | Exceptional 80.3% |
| Immigrants | Northern Africa | 99.0 /100 | #56 | Exceptional 80.3% |
| Afghans | 98.9 /100 | #57 | Exceptional 80.3% |
| Serbians | 98.9 /100 | #58 | Exceptional 80.3% |
| Swedes | 98.9 /100 | #59 | Exceptional 80.3% |
| Tongans | 98.8 /100 | #60 | Exceptional 80.3% |
| Burmese | 98.8 /100 | #61 | Exceptional 80.3% |
| Carpatho Rusyns | 98.8 /100 | #62 | Exceptional 80.3% |
| Immigrants | Korea | 98.8 /100 | #63 | Exceptional 80.3% |
| Immigrants | Albania | 98.7 /100 | #64 | Exceptional 80.3% |
| Lithuanians | 98.7 /100 | #65 | Exceptional 80.2% |
| Macedonians | 98.7 /100 | #66 | Exceptional 80.2% |
| Taiwanese | 98.6 /100 | #67 | Exceptional 80.2% |
| Bhutanese | 98.6 /100 | #68 | Exceptional 80.2% |
| Albanians | 98.6 /100 | #69 | Exceptional 80.2% |
| Immigrants | Turkey | 98.5 /100 | #70 | Exceptional 80.2% |
| Soviet Union | 98.5 /100 | #71 | Exceptional 80.2% |
| Eastern Europeans | 98.4 /100 | #72 | Exceptional 80.2% |
| Cypriots | 98.2 /100 | #73 | Exceptional 80.2% |
| Immigrants | Eastern Europe | 98.1 /100 | #74 | Exceptional 80.2% |