Serbian vs Trinidadian and Tobagonian In Labor Force | Age 20-64
COMPARE
Serbian
Trinidadian and Tobagonian
In Labor Force | Age 20-64
In Labor Force | Age 20-64 Comparison
Serbians
Trinidadians and Tobagonians
80.3%
IN LABOR FORCE | AGE 20-64
98.9/ 100
METRIC RATING
58th/ 347
METRIC RANK
79.0%
IN LABOR FORCE | AGE 20-64
2.3/ 100
METRIC RATING
240th/ 347
METRIC RANK
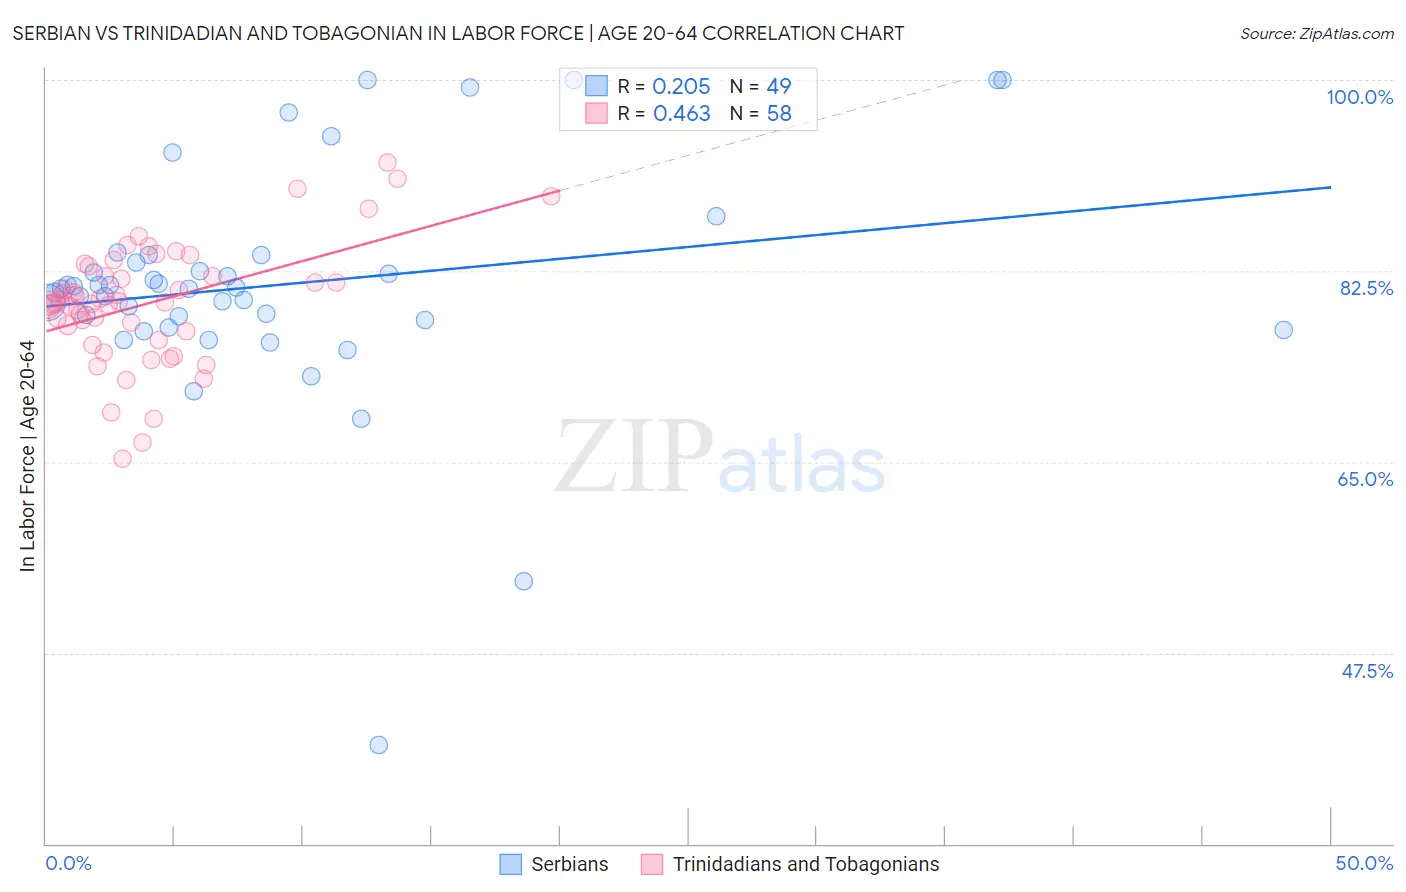
Serbian vs Trinidadian and Tobagonian In Labor Force | Age 20-64 Correlation Chart
The statistical analysis conducted on geographies consisting of 267,654,798 people shows a weak positive correlation between the proportion of Serbians and labor force participation rate among population between the ages 20 and 64 in the United States with a correlation coefficient (R) of 0.205 and weighted average of 80.3%. Similarly, the statistical analysis conducted on geographies consisting of 219,883,468 people shows a moderate positive correlation between the proportion of Trinidadians and Tobagonians and labor force participation rate among population between the ages 20 and 64 in the United States with a correlation coefficient (R) of 0.463 and weighted average of 79.0%, a difference of 1.7%.
In Labor Force | Age 20-64 Correlation Summary
| Measurement | Serbian | Trinidadian and Tobagonian |
| Minimum | 39.1% | 65.3% |
| Maximum | 100.0% | 92.4% |
| Range | 60.9% | 27.1% |
| Mean | 81.2% | 79.5% |
| Median | 80.9% | 79.6% |
| Interquartile 25% (IQ1) | 77.7% | 77.0% |
| Interquartile 75% (IQ3) | 83.6% | 82.0% |
| Interquartile Range (IQR) | 6.0% | 5.0% |
| Standard Deviation (Sample) | 10.6% | 5.4% |
| Standard Deviation (Population) | 10.5% | 5.4% |
Similar Demographics by In Labor Force | Age 20-64
Demographics Similar to Serbians by In Labor Force | Age 20-64
In terms of in labor force | age 20-64, the demographic groups most similar to Serbians are Swedish (80.3%, a difference of 0.0%), Immigrants from Northern Africa (80.3%, a difference of 0.010%), Afghan (80.3%, a difference of 0.010%), Tongan (80.3%, a difference of 0.010%), and Burmese (80.3%, a difference of 0.010%).
| Demographics | Rating | Rank | In Labor Force | Age 20-64 |
| Immigrants | Sri Lanka | 99.3 /100 | #51 | Exceptional 80.4% |
| Turks | 99.2 /100 | #52 | Exceptional 80.3% |
| Immigrants | Peru | 99.2 /100 | #53 | Exceptional 80.3% |
| Peruvians | 99.1 /100 | #54 | Exceptional 80.3% |
| Immigrants | Cabo Verde | 99.0 /100 | #55 | Exceptional 80.3% |
| Immigrants | Northern Africa | 99.0 /100 | #56 | Exceptional 80.3% |
| Afghans | 98.9 /100 | #57 | Exceptional 80.3% |
| Serbians | 98.9 /100 | #58 | Exceptional 80.3% |
| Swedes | 98.9 /100 | #59 | Exceptional 80.3% |
| Tongans | 98.8 /100 | #60 | Exceptional 80.3% |
| Burmese | 98.8 /100 | #61 | Exceptional 80.3% |
| Carpatho Rusyns | 98.8 /100 | #62 | Exceptional 80.3% |
| Immigrants | Korea | 98.8 /100 | #63 | Exceptional 80.3% |
| Immigrants | Albania | 98.7 /100 | #64 | Exceptional 80.3% |
| Lithuanians | 98.7 /100 | #65 | Exceptional 80.2% |
Demographics Similar to Trinidadians and Tobagonians by In Labor Force | Age 20-64
In terms of in labor force | age 20-64, the demographic groups most similar to Trinidadians and Tobagonians are Welsh (79.0%, a difference of 0.010%), Immigrants from Jamaica (79.0%, a difference of 0.020%), Jamaican (78.9%, a difference of 0.030%), Immigrants from North America (79.0%, a difference of 0.040%), and Immigrants from Micronesia (78.9%, a difference of 0.040%).
| Demographics | Rating | Rank | In Labor Force | Age 20-64 |
| Japanese | 4.0 /100 | #233 | Tragic 79.1% |
| Immigrants | Canada | 3.2 /100 | #234 | Tragic 79.0% |
| Tlingit-Haida | 3.2 /100 | #235 | Tragic 79.0% |
| Samoans | 2.9 /100 | #236 | Tragic 79.0% |
| Immigrants | North America | 2.9 /100 | #237 | Tragic 79.0% |
| Immigrants | Jamaica | 2.6 /100 | #238 | Tragic 79.0% |
| Welsh | 2.4 /100 | #239 | Tragic 79.0% |
| Trinidadians and Tobagonians | 2.3 /100 | #240 | Tragic 79.0% |
| Jamaicans | 2.0 /100 | #241 | Tragic 78.9% |
| Immigrants | Micronesia | 1.9 /100 | #242 | Tragic 78.9% |
| Immigrants | West Indies | 1.7 /100 | #243 | Tragic 78.9% |
| French | 1.5 /100 | #244 | Tragic 78.9% |
| Scottish | 1.3 /100 | #245 | Tragic 78.9% |
| Immigrants | Trinidad and Tobago | 1.1 /100 | #246 | Tragic 78.8% |
| Immigrants | Germany | 1.0 /100 | #247 | Tragic 78.8% |