Taiwanese vs Lithuanian In Labor Force | Age 25-29
COMPARE
Taiwanese
Lithuanian
In Labor Force | Age 25-29
In Labor Force | Age 25-29 Comparison
Taiwanese
Lithuanians
85.4%
IN LABOR FORCE | AGE 25-29
99.4/ 100
METRIC RATING
62nd/ 347
METRIC RANK
85.8%
IN LABOR FORCE | AGE 25-29
99.9/ 100
METRIC RATING
34th/ 347
METRIC RANK
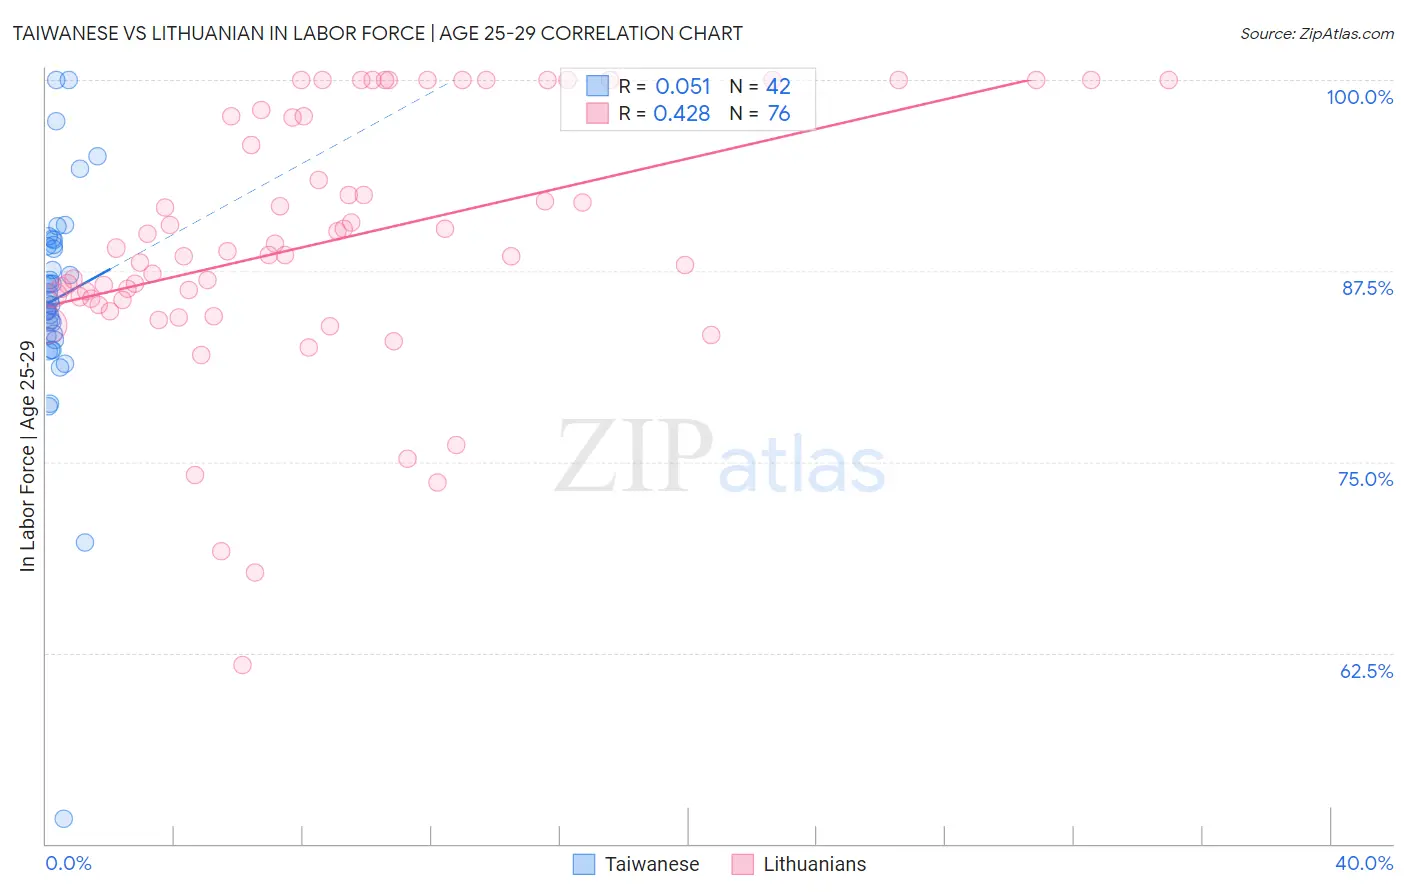
Taiwanese vs Lithuanian In Labor Force | Age 25-29 Correlation Chart
The statistical analysis conducted on geographies consisting of 31,716,840 people shows a slight positive correlation between the proportion of Taiwanese and labor force participation rate among population between the ages 25 and 29 in the United States with a correlation coefficient (R) of 0.051 and weighted average of 85.4%. Similarly, the statistical analysis conducted on geographies consisting of 421,659,157 people shows a moderate positive correlation between the proportion of Lithuanians and labor force participation rate among population between the ages 25 and 29 in the United States with a correlation coefficient (R) of 0.428 and weighted average of 85.8%, a difference of 0.43%.
In Labor Force | Age 25-29 Correlation Summary
| Measurement | Taiwanese | Lithuanian |
| Minimum | 51.6% | 61.7% |
| Maximum | 100.0% | 100.0% |
| Range | 48.4% | 38.3% |
| Mean | 85.7% | 89.5% |
| Median | 85.5% | 88.7% |
| Interquartile 25% (IQ1) | 83.2% | 85.6% |
| Interquartile 75% (IQ3) | 89.2% | 97.6% |
| Interquartile Range (IQR) | 6.0% | 11.9% |
| Standard Deviation (Sample) | 7.7% | 8.4% |
| Standard Deviation (Population) | 7.6% | 8.3% |
Similar Demographics by In Labor Force | Age 25-29
Demographics Similar to Taiwanese by In Labor Force | Age 25-29
In terms of in labor force | age 25-29, the demographic groups most similar to Taiwanese are Immigrants from Kenya (85.4%, a difference of 0.010%), Thai (85.5%, a difference of 0.020%), Serbian (85.5%, a difference of 0.020%), Immigrants from Italy (85.4%, a difference of 0.030%), and Immigrants from Czechoslovakia (85.4%, a difference of 0.030%).
| Demographics | Rating | Rank | In Labor Force | Age 25-29 |
| Immigrants | Brazil | 99.7 /100 | #55 | Exceptional 85.5% |
| Eastern Europeans | 99.6 /100 | #56 | Exceptional 85.5% |
| Estonians | 99.6 /100 | #57 | Exceptional 85.5% |
| Greeks | 99.6 /100 | #58 | Exceptional 85.5% |
| Immigrants | Morocco | 99.5 /100 | #59 | Exceptional 85.5% |
| Thais | 99.5 /100 | #60 | Exceptional 85.5% |
| Serbians | 99.5 /100 | #61 | Exceptional 85.5% |
| Taiwanese | 99.4 /100 | #62 | Exceptional 85.4% |
| Immigrants | Kenya | 99.4 /100 | #63 | Exceptional 85.4% |
| Immigrants | Italy | 99.3 /100 | #64 | Exceptional 85.4% |
| Immigrants | Czechoslovakia | 99.3 /100 | #65 | Exceptional 85.4% |
| Immigrants | Scotland | 99.3 /100 | #66 | Exceptional 85.4% |
| Immigrants | Turkey | 99.2 /100 | #67 | Exceptional 85.4% |
| Immigrants | Cameroon | 99.2 /100 | #68 | Exceptional 85.4% |
| Menominee | 99.1 /100 | #69 | Exceptional 85.4% |
Demographics Similar to Lithuanians by In Labor Force | Age 25-29
In terms of in labor force | age 25-29, the demographic groups most similar to Lithuanians are Cypriot (85.8%, a difference of 0.010%), Immigrants from Nepal (85.8%, a difference of 0.010%), German Russian (85.8%, a difference of 0.030%), Slovak (85.8%, a difference of 0.030%), and Immigrants from Bulgaria (85.8%, a difference of 0.030%).
| Demographics | Rating | Rank | In Labor Force | Age 25-29 |
| Paraguayans | 100.0 /100 | #27 | Exceptional 85.9% |
| Ugandans | 100.0 /100 | #28 | Exceptional 85.9% |
| Immigrants | Liberia | 100.0 /100 | #29 | Exceptional 85.9% |
| Immigrants | Serbia | 100.0 /100 | #30 | Exceptional 85.9% |
| German Russians | 100.0 /100 | #31 | Exceptional 85.8% |
| Slovaks | 100.0 /100 | #32 | Exceptional 85.8% |
| Immigrants | Bulgaria | 100.0 /100 | #33 | Exceptional 85.8% |
| Lithuanians | 99.9 /100 | #34 | Exceptional 85.8% |
| Cypriots | 99.9 /100 | #35 | Exceptional 85.8% |
| Immigrants | Nepal | 99.9 /100 | #36 | Exceptional 85.8% |
| Poles | 99.9 /100 | #37 | Exceptional 85.8% |
| Sierra Leoneans | 99.9 /100 | #38 | Exceptional 85.8% |
| Croatians | 99.9 /100 | #39 | Exceptional 85.8% |
| Immigrants | Albania | 99.9 /100 | #40 | Exceptional 85.7% |
| Immigrants | Greece | 99.9 /100 | #41 | Exceptional 85.7% |