Scottish vs Lithuanian In Labor Force | Age 35-44
COMPARE
Scottish
Lithuanian
In Labor Force | Age 35-44
In Labor Force | Age 35-44 Comparison
Scottish
Lithuanians
83.9%
IN LABOR FORCE | AGE 35-44
3.2/ 100
METRIC RATING
231st/ 347
METRIC RANK
85.2%
IN LABOR FORCE | AGE 35-44
99.8/ 100
METRIC RATING
44th/ 347
METRIC RANK
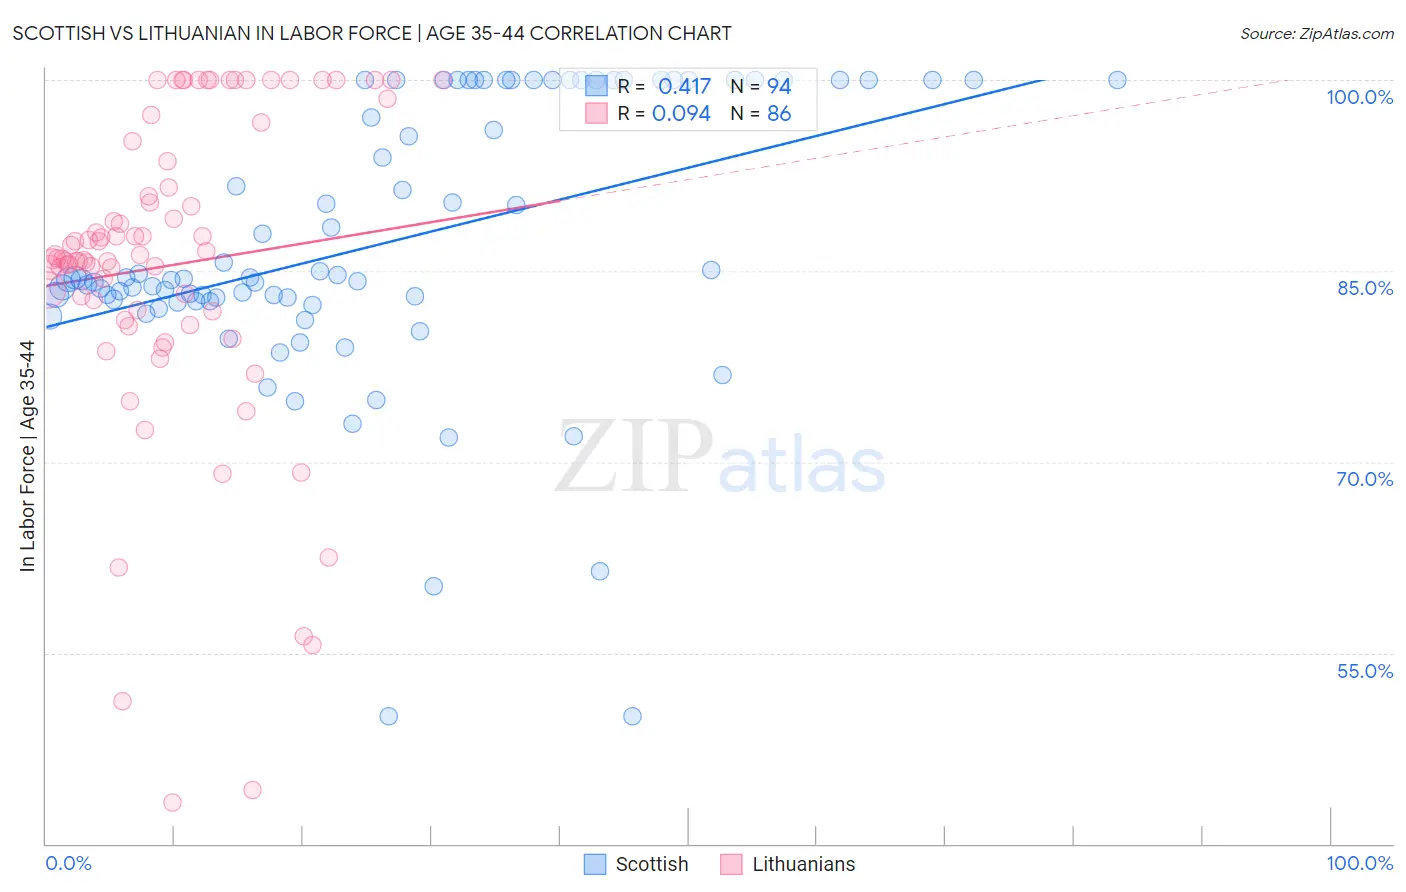
Scottish vs Lithuanian In Labor Force | Age 35-44 Correlation Chart
The statistical analysis conducted on geographies consisting of 566,464,566 people shows a moderate positive correlation between the proportion of Scottish and labor force participation rate among population between the ages 35 and 44 in the United States with a correlation coefficient (R) of 0.417 and weighted average of 83.9%. Similarly, the statistical analysis conducted on geographies consisting of 421,725,431 people shows a slight positive correlation between the proportion of Lithuanians and labor force participation rate among population between the ages 35 and 44 in the United States with a correlation coefficient (R) of 0.094 and weighted average of 85.2%, a difference of 1.6%.
In Labor Force | Age 35-44 Correlation Summary
| Measurement | Scottish | Lithuanian |
| Minimum | 50.0% | 43.2% |
| Maximum | 100.0% | 100.0% |
| Range | 50.0% | 56.8% |
| Mean | 87.1% | 85.4% |
| Median | 84.4% | 86.0% |
| Interquartile 25% (IQ1) | 82.6% | 81.8% |
| Interquartile 75% (IQ3) | 100.0% | 93.7% |
| Interquartile Range (IQR) | 17.4% | 11.9% |
| Standard Deviation (Sample) | 10.9% | 12.5% |
| Standard Deviation (Population) | 10.8% | 12.4% |
Similar Demographics by In Labor Force | Age 35-44
Demographics Similar to Scottish by In Labor Force | Age 35-44
In terms of in labor force | age 35-44, the demographic groups most similar to Scottish are Native Hawaiian (83.9%, a difference of 0.010%), Immigrants from Germany (83.9%, a difference of 0.020%), Immigrants from Iraq (83.9%, a difference of 0.030%), Immigrants from Oceania (83.9%, a difference of 0.030%), and Immigrants from Syria (83.9%, a difference of 0.040%).
| Demographics | Rating | Rank | In Labor Force | Age 35-44 |
| U.S. Virgin Islanders | 6.1 /100 | #224 | Tragic 84.0% |
| Immigrants | Burma/Myanmar | 6.1 /100 | #225 | Tragic 84.0% |
| Panamanians | 5.4 /100 | #226 | Tragic 84.0% |
| British West Indians | 5.3 /100 | #227 | Tragic 84.0% |
| Welsh | 5.3 /100 | #228 | Tragic 84.0% |
| Immigrants | Thailand | 4.7 /100 | #229 | Tragic 84.0% |
| Immigrants | Iraq | 3.7 /100 | #230 | Tragic 83.9% |
| Scottish | 3.2 /100 | #231 | Tragic 83.9% |
| Native Hawaiians | 3.0 /100 | #232 | Tragic 83.9% |
| Immigrants | Germany | 2.8 /100 | #233 | Tragic 83.9% |
| Immigrants | Oceania | 2.6 /100 | #234 | Tragic 83.9% |
| Immigrants | Syria | 2.5 /100 | #235 | Tragic 83.9% |
| West Indians | 2.4 /100 | #236 | Tragic 83.9% |
| English | 1.8 /100 | #237 | Tragic 83.8% |
| Immigrants | Laos | 1.7 /100 | #238 | Tragic 83.8% |
Demographics Similar to Lithuanians by In Labor Force | Age 35-44
In terms of in labor force | age 35-44, the demographic groups most similar to Lithuanians are Polish (85.2%, a difference of 0.0%), Immigrants from Bulgaria (85.2%, a difference of 0.010%), Immigrants from Zimbabwe (85.2%, a difference of 0.010%), Macedonian (85.2%, a difference of 0.010%), and Cypriot (85.2%, a difference of 0.010%).
| Demographics | Rating | Rank | In Labor Force | Age 35-44 |
| Kenyans | 99.8 /100 | #37 | Exceptional 85.2% |
| Immigrants | Poland | 99.8 /100 | #38 | Exceptional 85.2% |
| Eastern Europeans | 99.8 /100 | #39 | Exceptional 85.2% |
| Immigrants | Bulgaria | 99.8 /100 | #40 | Exceptional 85.2% |
| Immigrants | Zimbabwe | 99.8 /100 | #41 | Exceptional 85.2% |
| Macedonians | 99.8 /100 | #42 | Exceptional 85.2% |
| Poles | 99.8 /100 | #43 | Exceptional 85.2% |
| Lithuanians | 99.8 /100 | #44 | Exceptional 85.2% |
| Cypriots | 99.8 /100 | #45 | Exceptional 85.2% |
| Immigrants | Hong Kong | 99.8 /100 | #46 | Exceptional 85.2% |
| German Russians | 99.8 /100 | #47 | Exceptional 85.2% |
| Immigrants | Eritrea | 99.7 /100 | #48 | Exceptional 85.2% |
| Croatians | 99.7 /100 | #49 | Exceptional 85.2% |
| Thais | 99.7 /100 | #50 | Exceptional 85.2% |
| Immigrants | Albania | 99.7 /100 | #51 | Exceptional 85.1% |