Scottish vs Lithuanian Kindergarten
COMPARE
Scottish
Lithuanian
Kindergarten
Kindergarten Comparison
Scottish
Lithuanians
98.6%
KINDERGARTEN
100.0/ 100
METRIC RATING
17th/ 347
METRIC RANK
98.6%
KINDERGARTEN
100.0/ 100
METRIC RATING
21st/ 347
METRIC RANK
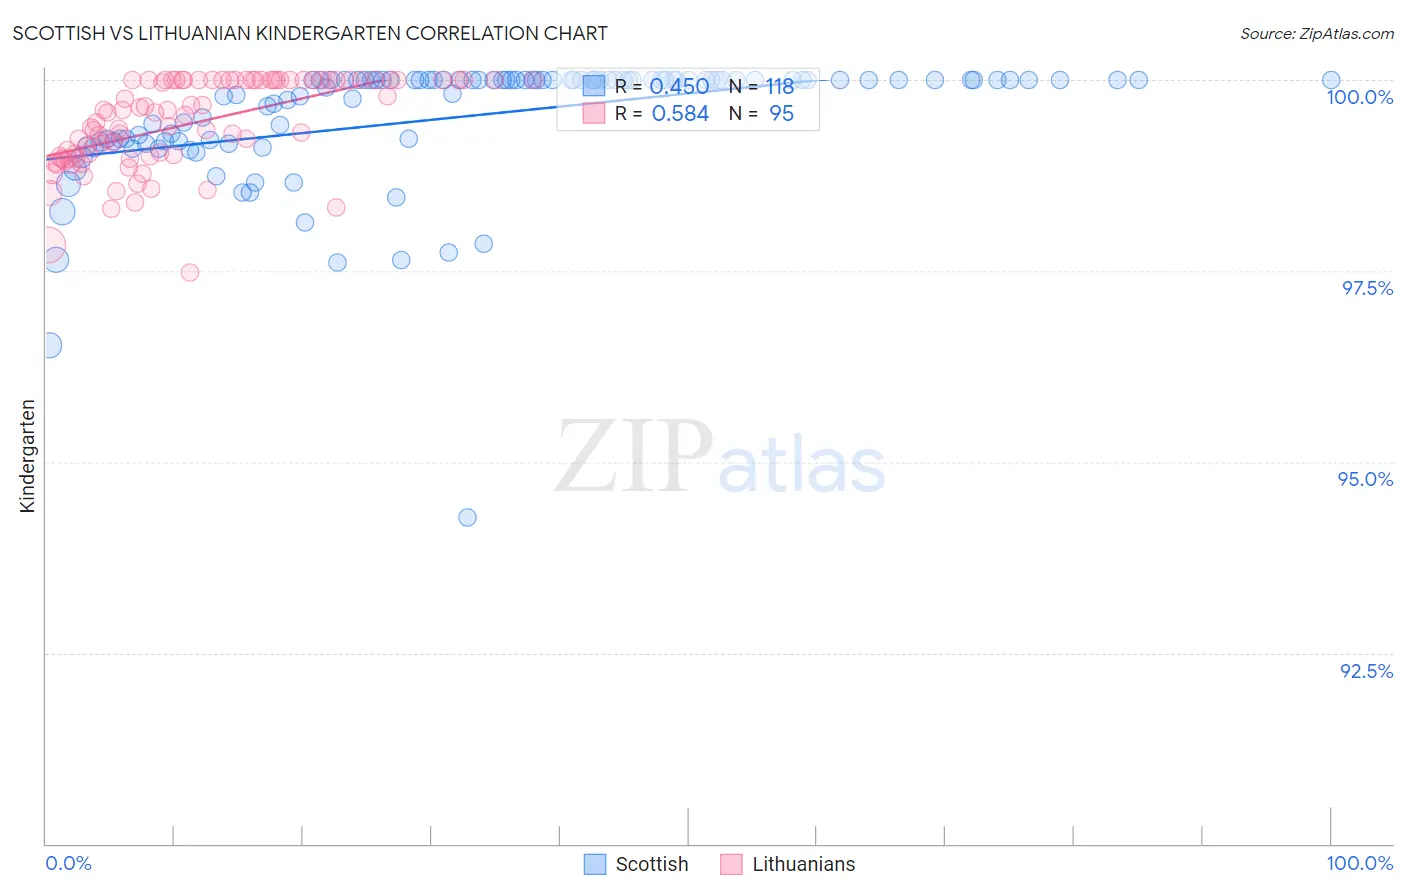
Scottish vs Lithuanian Kindergarten Correlation Chart
The statistical analysis conducted on geographies consisting of 567,141,733 people shows a moderate positive correlation between the proportion of Scottish and percentage of population with at least kindergarten education in the United States with a correlation coefficient (R) of 0.450 and weighted average of 98.6%. Similarly, the statistical analysis conducted on geographies consisting of 421,946,231 people shows a substantial positive correlation between the proportion of Lithuanians and percentage of population with at least kindergarten education in the United States with a correlation coefficient (R) of 0.584 and weighted average of 98.6%, a difference of 0.040%.
Kindergarten Correlation Summary
| Measurement | Scottish | Lithuanian |
| Minimum | 94.3% | 97.5% |
| Maximum | 100.0% | 100.0% |
| Range | 5.7% | 2.5% |
| Mean | 99.5% | 99.4% |
| Median | 100.0% | 99.6% |
| Interquartile 25% (IQ1) | 99.2% | 99.0% |
| Interquartile 75% (IQ3) | 100.0% | 100.0% |
| Interquartile Range (IQR) | 0.80% | 1.0% |
| Standard Deviation (Sample) | 0.84% | 0.58% |
| Standard Deviation (Population) | 0.83% | 0.58% |
Demographics Similar to Scottish and Lithuanians by Kindergarten
In terms of kindergarten, the demographic groups most similar to Scottish are Aleut (98.6%, a difference of 0.0%), Swedish (98.7%, a difference of 0.010%), Dutch (98.6%, a difference of 0.010%), Carpatho Rusyn (98.7%, a difference of 0.030%), and English (98.7%, a difference of 0.030%). Similarly, the demographic groups most similar to Lithuanians are Pennsylvania German (98.6%, a difference of 0.0%), Finnish (98.6%, a difference of 0.0%), Arapaho (98.6%, a difference of 0.0%), Danish (98.6%, a difference of 0.0%), and Sioux (98.6%, a difference of 0.0%).
| Demographics | Rating | Rank | Kindergarten |
| Tlingit-Haida | 100.0 /100 | #9 | Exceptional 98.7% |
| Slovaks | 100.0 /100 | #10 | Exceptional 98.7% |
| Germans | 100.0 /100 | #11 | Exceptional 98.7% |
| Slovenes | 100.0 /100 | #12 | Exceptional 98.7% |
| Carpatho Rusyns | 100.0 /100 | #13 | Exceptional 98.7% |
| English | 100.0 /100 | #14 | Exceptional 98.7% |
| Swedes | 100.0 /100 | #15 | Exceptional 98.7% |
| Aleuts | 100.0 /100 | #16 | Exceptional 98.6% |
| Scottish | 100.0 /100 | #17 | Exceptional 98.6% |
| Dutch | 100.0 /100 | #18 | Exceptional 98.6% |
| Irish | 100.0 /100 | #19 | Exceptional 98.6% |
| Pennsylvania Germans | 100.0 /100 | #20 | Exceptional 98.6% |
| Lithuanians | 100.0 /100 | #21 | Exceptional 98.6% |
| Finns | 100.0 /100 | #22 | Exceptional 98.6% |
| Arapaho | 100.0 /100 | #23 | Exceptional 98.6% |
| Danes | 100.0 /100 | #24 | Exceptional 98.6% |
| Sioux | 100.0 /100 | #25 | Exceptional 98.6% |
| Poles | 100.0 /100 | #26 | Exceptional 98.6% |
| Scotch-Irish | 100.0 /100 | #27 | Exceptional 98.6% |
| Croatians | 100.0 /100 | #28 | Exceptional 98.6% |
| French | 100.0 /100 | #29 | Exceptional 98.6% |