Scottish vs Immigrants from Israel In Labor Force | Age > 16
COMPARE
Scottish
Immigrants from Israel
In Labor Force | Age > 16
In Labor Force | Age > 16 Comparison
Scottish
Immigrants from Israel
63.9%
IN LABOR FORCE | AGE > 16
0.1/ 100
METRIC RATING
287th/ 347
METRIC RANK
65.2%
IN LABOR FORCE | AGE > 16
61.7/ 100
METRIC RATING
170th/ 347
METRIC RANK
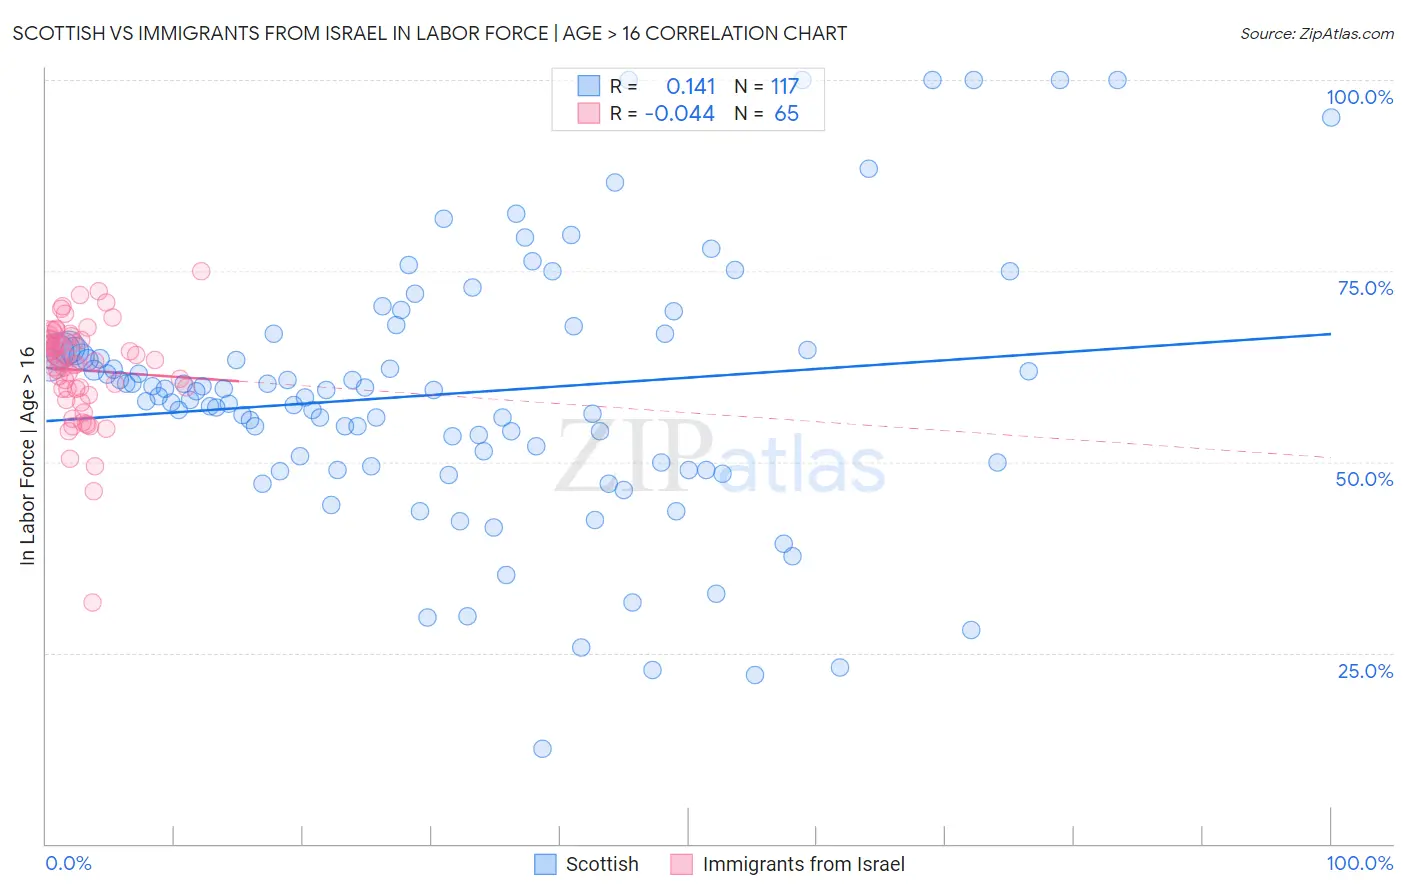
Scottish vs Immigrants from Israel In Labor Force | Age > 16 Correlation Chart
The statistical analysis conducted on geographies consisting of 567,155,929 people shows a poor positive correlation between the proportion of Scottish and labor force participation rate among population ages 16 and over in the United States with a correlation coefficient (R) of 0.141 and weighted average of 63.9%. Similarly, the statistical analysis conducted on geographies consisting of 210,034,419 people shows no correlation between the proportion of Immigrants from Israel and labor force participation rate among population ages 16 and over in the United States with a correlation coefficient (R) of -0.044 and weighted average of 65.2%, a difference of 2.1%.
In Labor Force | Age > 16 Correlation Summary
| Measurement | Scottish | Immigrants from Israel |
| Minimum | 12.5% | 31.5% |
| Maximum | 100.0% | 75.0% |
| Range | 87.5% | 43.5% |
| Mean | 58.9% | 62.0% |
| Median | 59.3% | 63.1% |
| Interquartile 25% (IQ1) | 49.7% | 59.2% |
| Interquartile 75% (IQ3) | 64.8% | 66.1% |
| Interquartile Range (IQR) | 15.1% | 7.0% |
| Standard Deviation (Sample) | 17.1% | 6.9% |
| Standard Deviation (Population) | 17.1% | 6.8% |
Similar Demographics by In Labor Force | Age > 16
Demographics Similar to Scottish by In Labor Force | Age > 16
In terms of in labor force | age > 16, the demographic groups most similar to Scottish are Immigrants from Austria (63.9%, a difference of 0.0%), Slovak (63.9%, a difference of 0.030%), Spanish (63.9%, a difference of 0.050%), French (63.9%, a difference of 0.060%), and Immigrants from Germany (63.9%, a difference of 0.070%).
| Demographics | Rating | Rank | In Labor Force | Age > 16 |
| Immigrants | St. Vincent and the Grenadines | 0.2 /100 | #280 | Tragic 64.0% |
| French Canadians | 0.2 /100 | #281 | Tragic 64.0% |
| Immigrants | Guyana | 0.2 /100 | #282 | Tragic 64.0% |
| Immigrants | Germany | 0.1 /100 | #283 | Tragic 63.9% |
| French | 0.1 /100 | #284 | Tragic 63.9% |
| Slovaks | 0.1 /100 | #285 | Tragic 63.9% |
| Immigrants | Austria | 0.1 /100 | #286 | Tragic 63.9% |
| Scottish | 0.1 /100 | #287 | Tragic 63.9% |
| Spanish | 0.1 /100 | #288 | Tragic 63.9% |
| Celtics | 0.1 /100 | #289 | Tragic 63.8% |
| Hungarians | 0.1 /100 | #290 | Tragic 63.8% |
| Nepalese | 0.1 /100 | #291 | Tragic 63.8% |
| Spanish American Indians | 0.1 /100 | #292 | Tragic 63.8% |
| English | 0.1 /100 | #293 | Tragic 63.7% |
| Puget Sound Salish | 0.0 /100 | #294 | Tragic 63.7% |
Demographics Similar to Immigrants from Israel by In Labor Force | Age > 16
In terms of in labor force | age > 16, the demographic groups most similar to Immigrants from Israel are Israeli (65.2%, a difference of 0.0%), Immigrants from Sweden (65.2%, a difference of 0.0%), Arab (65.2%, a difference of 0.010%), Serbian (65.2%, a difference of 0.020%), and Immigrants from Belarus (65.2%, a difference of 0.050%).
| Demographics | Rating | Rank | In Labor Force | Age > 16 |
| South Africans | 69.8 /100 | #163 | Good 65.3% |
| Danes | 68.8 /100 | #164 | Good 65.3% |
| Immigrants | Kazakhstan | 68.1 /100 | #165 | Good 65.3% |
| Immigrants | Western Asia | 67.3 /100 | #166 | Good 65.3% |
| Immigrants | Belarus | 66.0 /100 | #167 | Good 65.2% |
| Serbians | 63.5 /100 | #168 | Good 65.2% |
| Arabs | 62.4 /100 | #169 | Good 65.2% |
| Immigrants | Israel | 61.7 /100 | #170 | Good 65.2% |
| Israelis | 61.6 /100 | #171 | Good 65.2% |
| Immigrants | Sweden | 61.3 /100 | #172 | Good 65.2% |
| Immigrants | Ukraine | 53.7 /100 | #173 | Average 65.1% |
| Macedonians | 50.0 /100 | #174 | Average 65.1% |
| Nicaraguans | 49.7 /100 | #175 | Average 65.1% |
| Swedes | 47.4 /100 | #176 | Average 65.1% |
| Eastern Europeans | 46.2 /100 | #177 | Average 65.1% |