Scotch-Irish vs Puerto Rican 12th Grade, No Diploma
COMPARE
Scotch-Irish
Puerto Rican
12th Grade, No Diploma
12th Grade, No Diploma Comparison
Scotch-Irish
Puerto Ricans
92.4%
12TH GRADE, NO DIPLOMA
98.8/ 100
METRIC RATING
88th/ 347
METRIC RANK
86.5%
12TH GRADE, NO DIPLOMA
0.0/ 100
METRIC RATING
321st/ 347
METRIC RANK
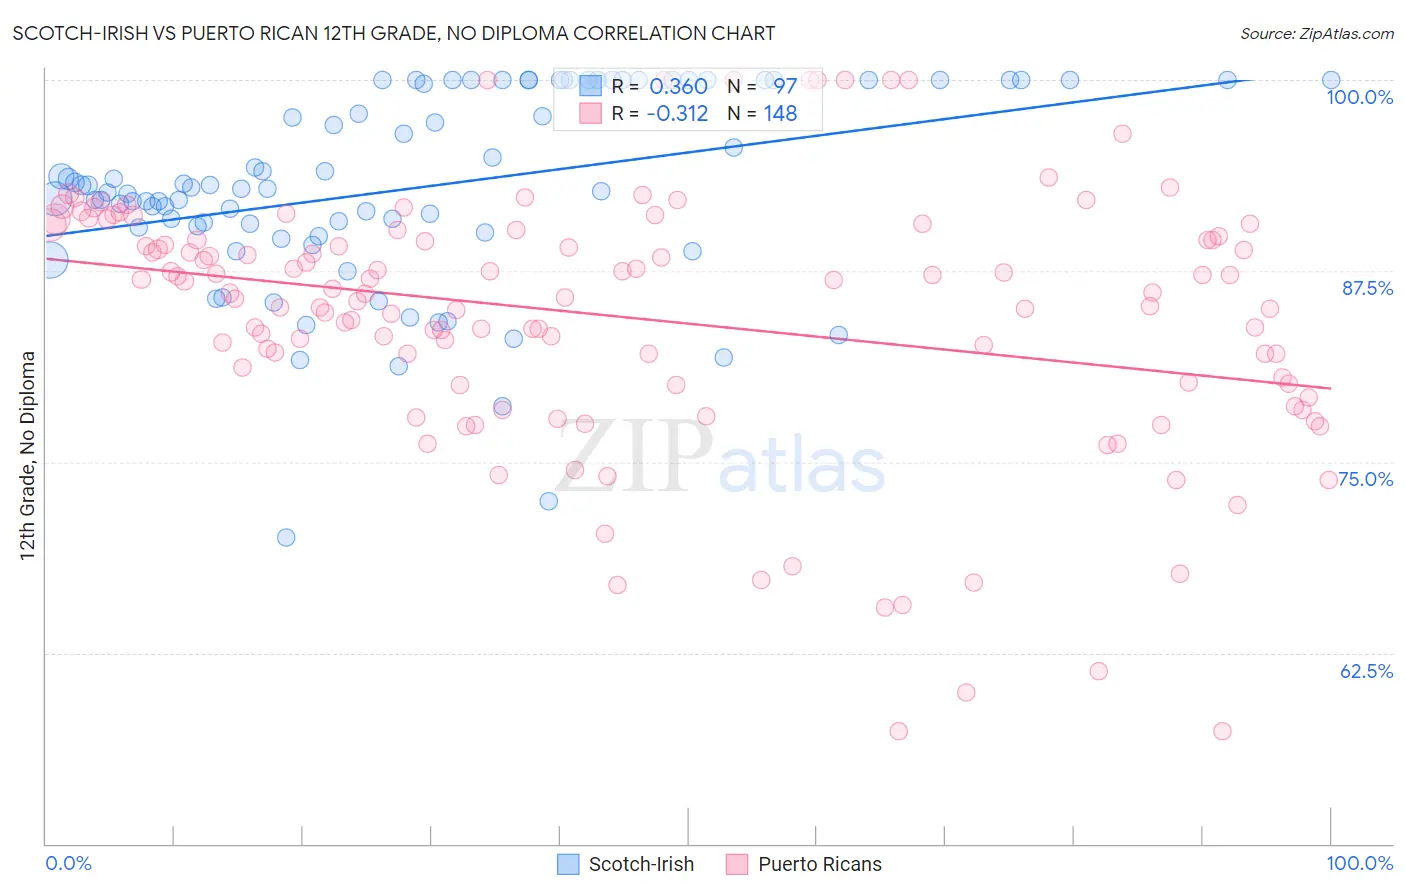
Scotch-Irish vs Puerto Rican 12th Grade, No Diploma Correlation Chart
The statistical analysis conducted on geographies consisting of 548,779,904 people shows a mild positive correlation between the proportion of Scotch-Irish and percentage of population with at least 12th grade (no diploma) education in the United States with a correlation coefficient (R) of 0.360 and weighted average of 92.4%. Similarly, the statistical analysis conducted on geographies consisting of 528,321,878 people shows a mild negative correlation between the proportion of Puerto Ricans and percentage of population with at least 12th grade (no diploma) education in the United States with a correlation coefficient (R) of -0.312 and weighted average of 86.5%, a difference of 6.8%.
12th Grade, No Diploma Correlation Summary
| Measurement | Scotch-Irish | Puerto Rican |
| Minimum | 70.0% | 57.4% |
| Maximum | 100.0% | 100.0% |
| Range | 30.0% | 42.6% |
| Mean | 92.9% | 84.5% |
| Median | 92.9% | 86.0% |
| Interquartile 25% (IQ1) | 90.2% | 80.2% |
| Interquartile 75% (IQ3) | 100.0% | 89.6% |
| Interquartile Range (IQR) | 9.8% | 9.5% |
| Standard Deviation (Sample) | 6.4% | 8.5% |
| Standard Deviation (Population) | 6.4% | 8.4% |
Similar Demographics by 12th Grade, No Diploma
Demographics Similar to Scotch-Irish by 12th Grade, No Diploma
In terms of 12th grade, no diploma, the demographic groups most similar to Scotch-Irish are Immigrants from France (92.4%, a difference of 0.010%), Immigrants from Turkey (92.4%, a difference of 0.030%), Canadian (92.4%, a difference of 0.030%), Immigrants from Serbia (92.4%, a difference of 0.040%), and South African (92.4%, a difference of 0.040%).
| Demographics | Rating | Rank | 12th Grade, No Diploma |
| Immigrants | Denmark | 99.2 /100 | #81 | Exceptional 92.5% |
| Immigrants | Switzerland | 99.2 /100 | #82 | Exceptional 92.5% |
| Immigrants | Israel | 99.2 /100 | #83 | Exceptional 92.5% |
| Immigrants | Bulgaria | 99.1 /100 | #84 | Exceptional 92.5% |
| Immigrants | Saudi Arabia | 99.0 /100 | #85 | Exceptional 92.5% |
| Immigrants | Turkey | 98.9 /100 | #86 | Exceptional 92.4% |
| Immigrants | France | 98.8 /100 | #87 | Exceptional 92.4% |
| Scotch-Irish | 98.8 /100 | #88 | Exceptional 92.4% |
| Canadians | 98.7 /100 | #89 | Exceptional 92.4% |
| Immigrants | Serbia | 98.6 /100 | #90 | Exceptional 92.4% |
| South Africans | 98.6 /100 | #91 | Exceptional 92.4% |
| Immigrants | Romania | 98.5 /100 | #92 | Exceptional 92.3% |
| Immigrants | Western Europe | 98.5 /100 | #93 | Exceptional 92.3% |
| Immigrants | Europe | 98.5 /100 | #94 | Exceptional 92.3% |
| Immigrants | North Macedonia | 98.5 /100 | #95 | Exceptional 92.3% |
Demographics Similar to Puerto Ricans by 12th Grade, No Diploma
In terms of 12th grade, no diploma, the demographic groups most similar to Puerto Ricans are Immigrants from Nicaragua (86.6%, a difference of 0.030%), Central American Indian (86.5%, a difference of 0.080%), Yuman (86.5%, a difference of 0.080%), Immigrants from Belize (87.0%, a difference of 0.49%), and Belizean (87.0%, a difference of 0.57%).
| Demographics | Rating | Rank | 12th Grade, No Diploma |
| Cape Verdeans | 0.0 /100 | #314 | Tragic 87.4% |
| Nicaraguans | 0.0 /100 | #315 | Tragic 87.3% |
| Apache | 0.0 /100 | #316 | Tragic 87.3% |
| Navajo | 0.0 /100 | #317 | Tragic 87.1% |
| Belizeans | 0.0 /100 | #318 | Tragic 87.0% |
| Immigrants | Belize | 0.0 /100 | #319 | Tragic 87.0% |
| Immigrants | Nicaragua | 0.0 /100 | #320 | Tragic 86.6% |
| Puerto Ricans | 0.0 /100 | #321 | Tragic 86.5% |
| Central American Indians | 0.0 /100 | #322 | Tragic 86.5% |
| Yuman | 0.0 /100 | #323 | Tragic 86.5% |
| Immigrants | Cabo Verde | 0.0 /100 | #324 | Tragic 85.8% |
| Mexican American Indians | 0.0 /100 | #325 | Tragic 85.7% |
| Dominicans | 0.0 /100 | #326 | Tragic 85.7% |
| Lumbee | 0.0 /100 | #327 | Tragic 85.7% |
| Hondurans | 0.0 /100 | #328 | Tragic 85.5% |